Getting an Overview of Your Project
You can get an immediate overview of how the total cost (labor plus expenses) is tracking toward the budget you set.
If you don’t see your project or don’t see the information you expect, view the Permissions and Roles for Tempo Projects for more information.
The Overview tab
Click the Overview tab in the upper right, or select any project from the project list on the Financial Manager home page to open this tab.
Hover over any part of the graph to see a breakdown of your project’s elements up to that date.
Depending on your project type, some tabs or fields are not displayed, such as the Expenses tab.
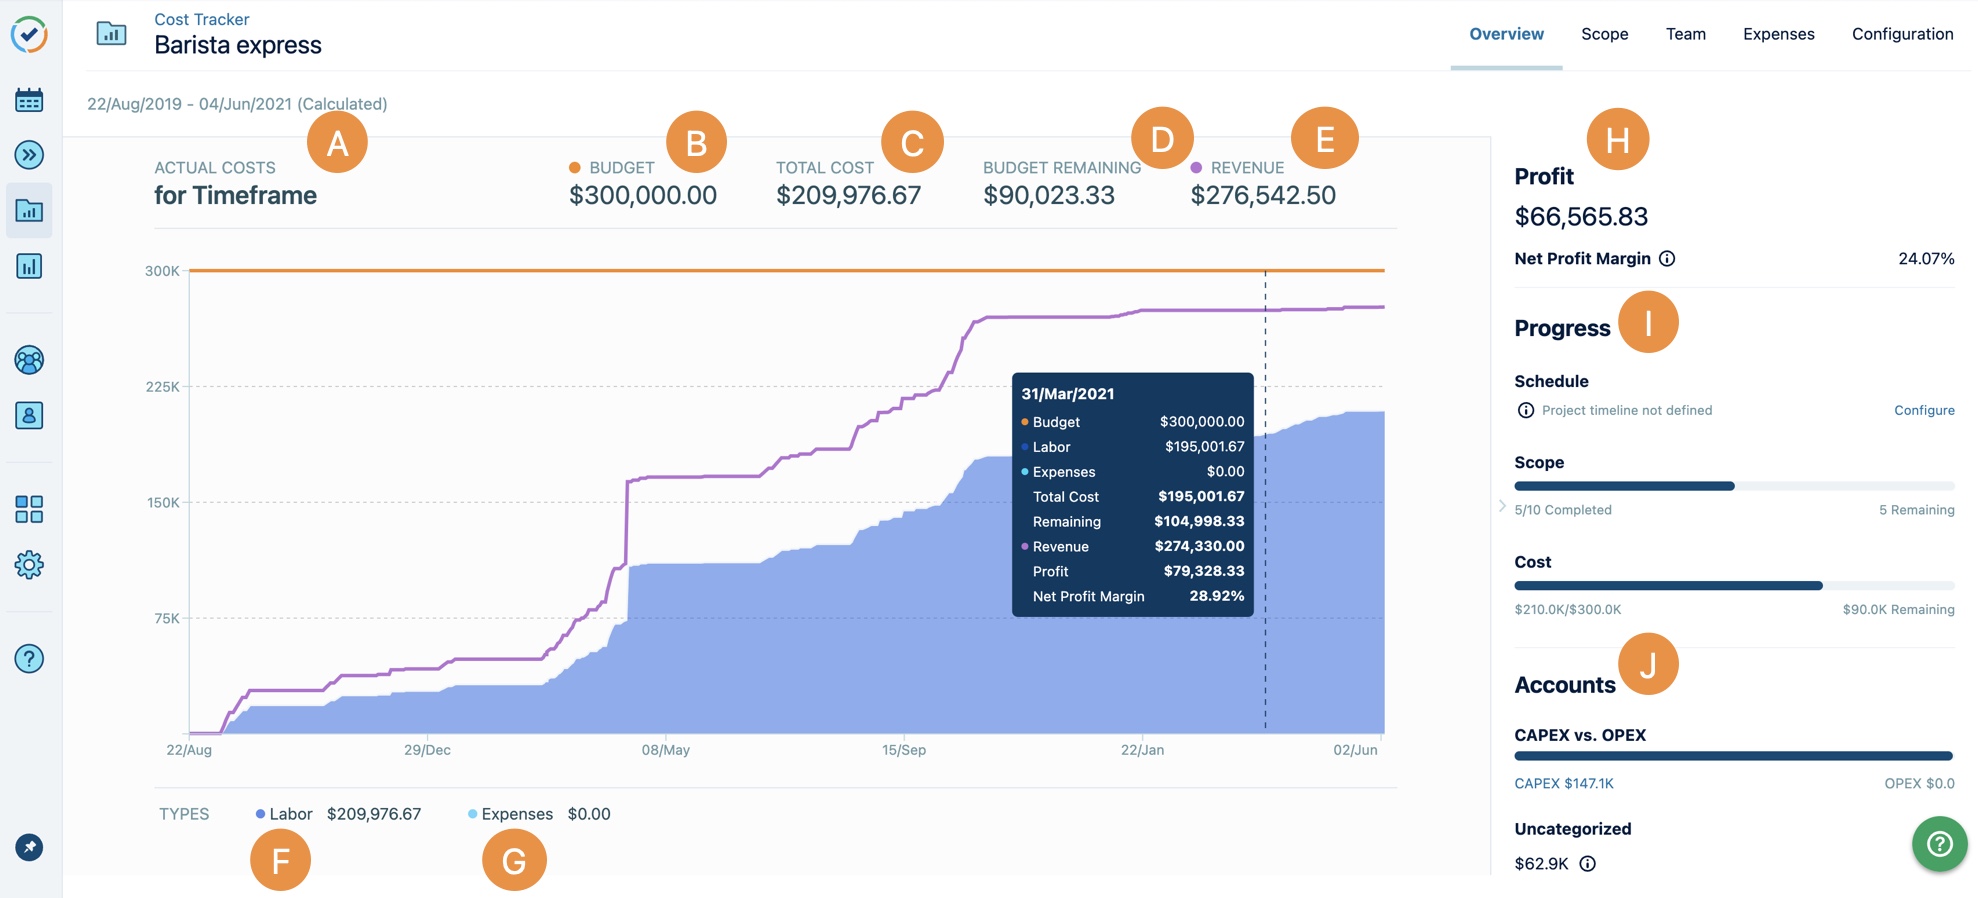
Letter | Element | What is it? |
|---|---|---|
A | The start and end dates of the project are determined either automatically or by a range that you set, shown at the bottom of the graph. The total timeframe is divided by 10. For very short timeframes, dates are shown in single digit increments. Work that occurs outside the timeframe is not represented. | |
B | The amount you have entered on the Configuration page, shown as an orange line. If you entered Budget Milestones, they appear as orange “steps”. For a time-based project, this is based on worked hours. | |
C | Total Cost | The labor cost plus expenses. For a time-based project, this is based on worked hours. |
D | Budget Remaining | The budget minus total cost. For a time-based project, this is based on worked hours. |
E | Revenue | This only appears if Revenue tracking is enabled. See Tracking a project's revenue for more. For a time-based project, this is based on worked hours. |
F | Labor | The number of hours logged by team members at the rate you’ve defined shown in dark blue. |
G | The fixed expenses for the project shown in light blue. | |
H | Profit | This only appears if Revenue tracking is enabled. See Tracking a project's revenue for more. |
I | Progress side panel | This displays an overview of the project's KPIs. |
J | Accounts | Compares expenses based on CAPEX and OPEX categorized accounts. For a time-based project, these are based on worked hours. |
Budget Milestones are shown as orange "steps" over the project's timeframe. If you’ve added a description to your budget milestones, you can quickly understand what the milestone entails by hovering over the milestone.
Tracking a Project's Revenue and Profitability
If Revenue Tracking is on, you’ll see the revenue generated for your project as a purple line on the graph. Revenue is calculated by multiplying the number of hours logged to a project (the hours that are considered billable) by a Billing Rate - see Tracking a Project's Revenue for more information.
You can compare the Total Cost to Revenue to see the profitability of your project. Profitability calculations are displayed above the Progress panel:
The Profit value is calculated based on (Revenue - Cost) .
The Net Profit Margin value is calculated based on (Revenue - Cost)/Revenue * 100 .
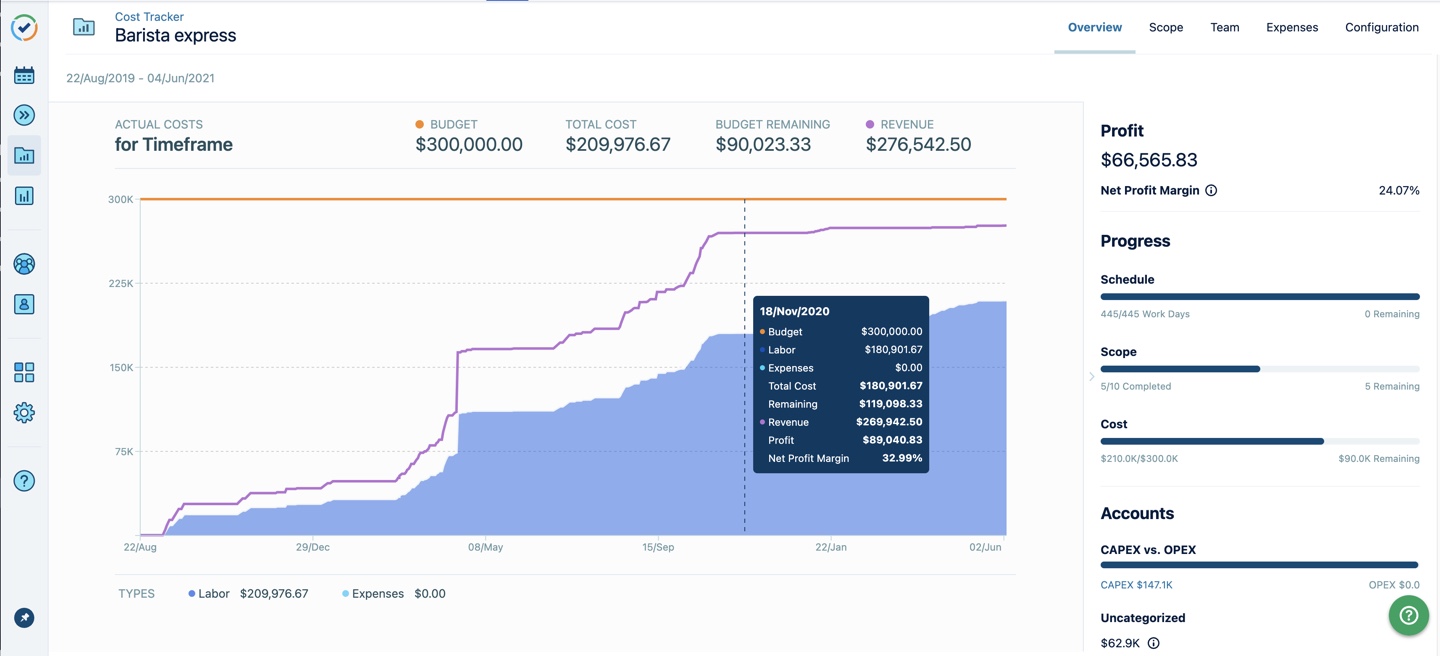
Hover over the chart to see the Revenue, Profit and Net Profit Margin calculations in the legend.
As you move along the x-axis representing the date in the graph you can see the profit and the net profit margin values over time. This indicates whether you have increasing, decreasing or stable profits across time.
You can expand the chart across the entire page or collapse it to its default view. Click on the chevron on right side of the chart to toggle between expanding it or collapsing it. This setting persists when navigating to this page again.
Viewing a Project's Progress
It's important to know whether your project is on schedule, within budget and how much work there is left to do. You can use the Progress side panel to measure your project's success by monitoring your key performance indicators (KPIs). You can quickly glance at the progress bar for each KPI to gain insight on the status of the project and compare KPIs against each other.
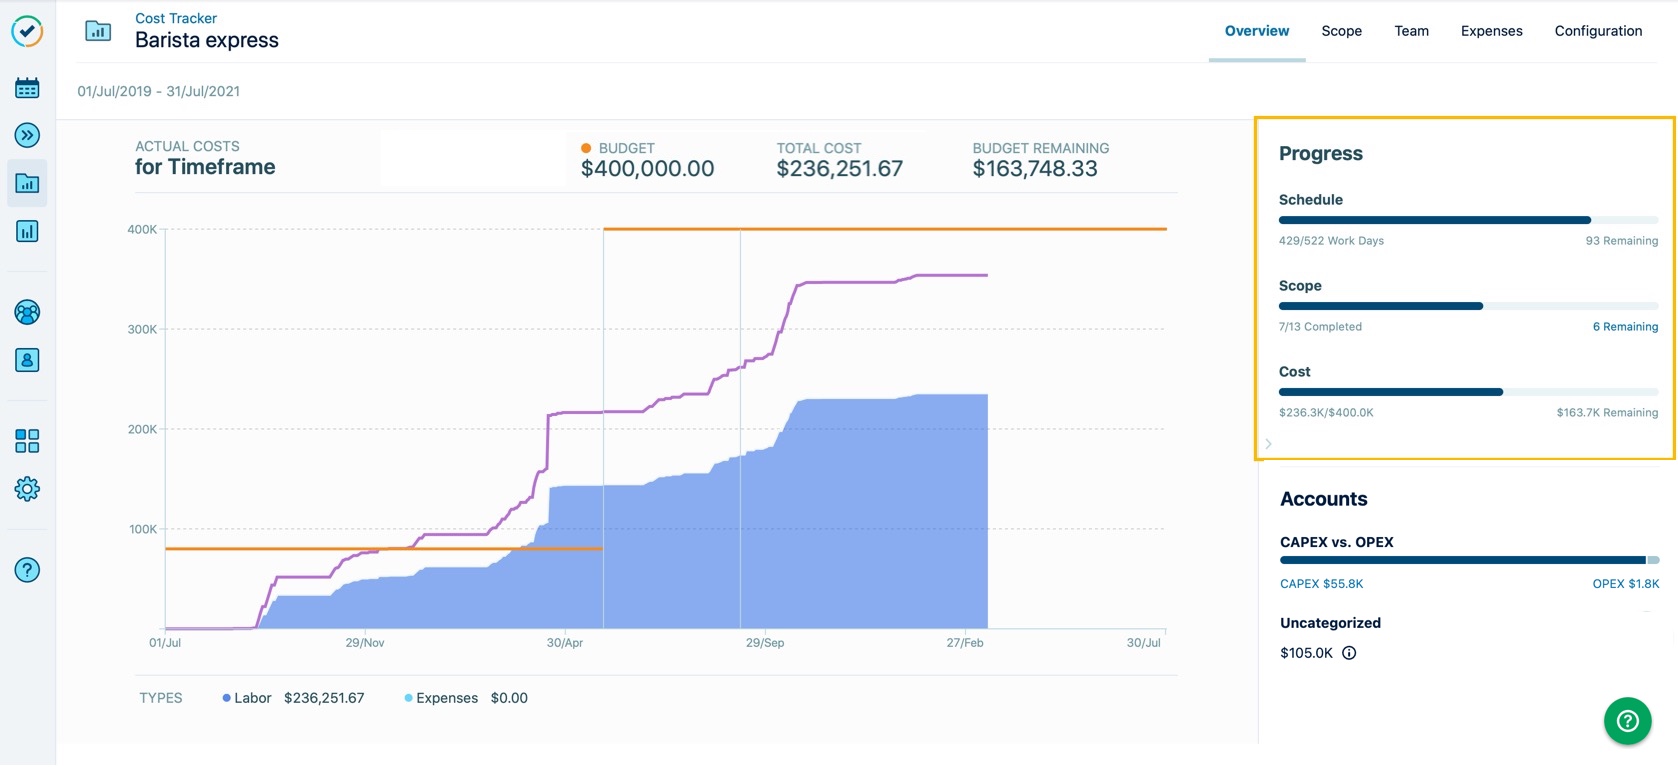
In the Progress side panel, each KPI's progress bar is stacked on top of each other and can be used to easily compare them.
For example, when a project's Scope is further along than its Schedule, this means that the project is progressing ahead of schedule.
Schedule
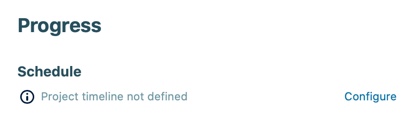
The Schedule shows you how you're tracking towards your project deadline and how many working days remain until your project deadline. The working days are based on the holiday and workload schemes defined by Tempo's default holiday and workload schemes. This date is retrieved from the timeframe set for the project in the Configuration page. If no timeframe is defined, then a Schedule progress bar will not be displayed. To learn more about how calculated timeframes work, see Setting the Project's Timeframe.
To set the schedule for a new project, select Configure and select the start and end dates from the date picker. You can go back to the Configuration page to Revert back to a calculated timeframe but you will no longer be able to view anything in the Schedule section.
Scope
The Scope shows you the number of completed tasks and how many are left to be completed in your project. If you want to view the tasks, select "XX remaining" to be redirected to your project's scope page. A completed task is one with a resolution (e.g., Done, Closed). To learn more about resolutions, go here.
To set the scope for a new project, select Set Scope and select the Jira filter, structure, Jira projects, or Jira epics you want to use for the project. This will import the tasks and time records associated with the scope.
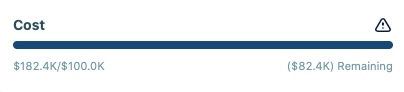
Cost
The Cost shows you the actual cost, total budget and how much of your budget remains for your project. The actual cost is the sum of the labor costs (based on time records) and expenses.
To set a budget for a new project, select Configure and enter the budget in the Configuration page.
If you are over your budget, then an attention icon will appear and you'll be able to see the amount you are above your budget by.
For example, this project is above its budget by $82.4K:
By default, the Progress side panel will always appear on the right side of the Financial Manager project overview screen. If you want to hide the Progress side panel, you can collapse it and Financial Manager will remember your preference for that specific project on that browser. You can reopen it at any time using the side arrow.