Step 6 - Create a Timeline Visualization
Timelines vs. Swimlanes
Strategic Roadmaps has two types of visualization: Timelines and Swimlanes.
Timelines are the more traditional way of visualizing a roadmap, showing a time-oriented view of items such as initiatives and objectives punctuated by milestones to highlight goals, achievement, and other important time markers.
Swimlanes are the right choice when you need a more agile theme-based roadmap that allows you to plot items on a dynamic grid and pivot data in multiple ways.
Because they offer a more traditional type of visualization, we first take a look at Timelines. We'll get back to Swimlanes later on in this tutorial (Step 7. Create a Swimlane Visualization).
Timelines and views
Each roadmap can have multiple Timelines. To create a Timeline for a roadmap, you create a roadmap view and then create a Timeline visualization associated with the view. Views in Strategic Roadmaps allow you to create and save different ways of looking at the same roadmap, each with its own visualization, filterset, data pivots and, in the case of a Timeline, milestones. A roadmap can have several views and therefore several different Timelines.
Timelines and dates
In step 2 of the tutorial, Create and import items, you saw how you can assign an item to a time bucket, such as Soon or Future, if the item doesn't have fixed dates yet. While buckets are great when visualizing items in a Swimlane, they don't work well in Timelines. In fact, for an item to be visible in a Timeline, it must have dates. If many of the items in your roadmap are assigned to buckets, it may make more sense to visualize them as a Swimlane.
View 1: The roadmap default view
Every roadmap you create comes with a default view named View 1. View 1 doesn't have a visualization or filters yet so it contains all the items in the roadmap (you'll learn about filters later on in Add and apply filters to a view).
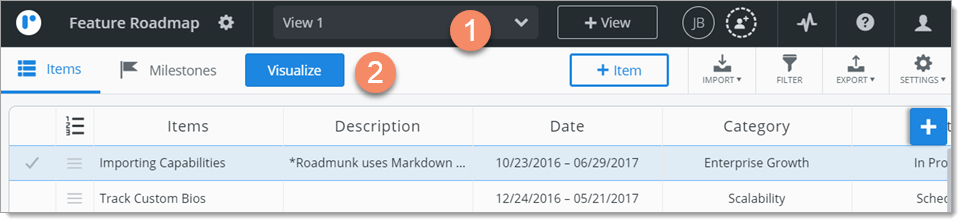
On the Roadmap navbar, you can see View 1 in the View dropdown with the Create View (+ View) button to the right of it. The View dropdown is where you select the roadmap view you want to open.
Below the Roadmap navbar is the View navbar. Since you're looking at the Items Table, the Items icon is selected on the navbar. A bit over to the right on the navbar is the Visualize button which, you guessed it, is what you use to create a visualization for a view.
Changing the view name
By the way, you're not stuck with View 1 as the name for your Timeline. You can change the name of the view by clicking the Settings icon at the far right of the View navbar, then selecting Rename View in the dropdown. For the tutorial, we'll change the name to My first view.
Create a Timeline visualization for the view
Now that you know how views and visualizations work together, you're ready to create a Timeline visualization for your first view.
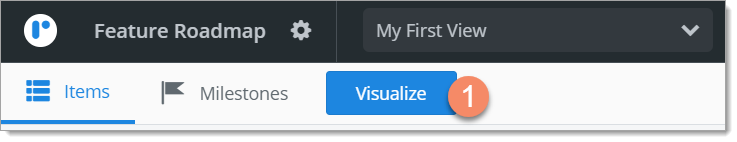
1. On the View navbar, click the Visualize button.
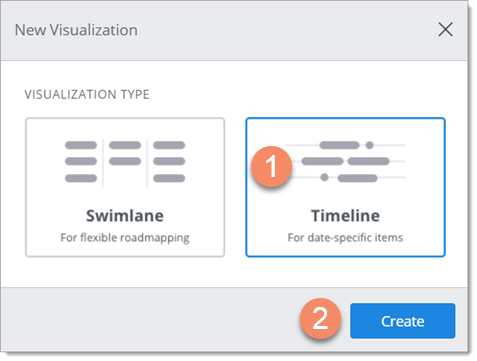
2. In the New Visualization dialog, select Timeline.
3. Click Create.
When the new Timeline appears, the Visualize button is replaced by a selected Timeline icon. You can go back to the Items Table any time by selecting the Items icon instead.
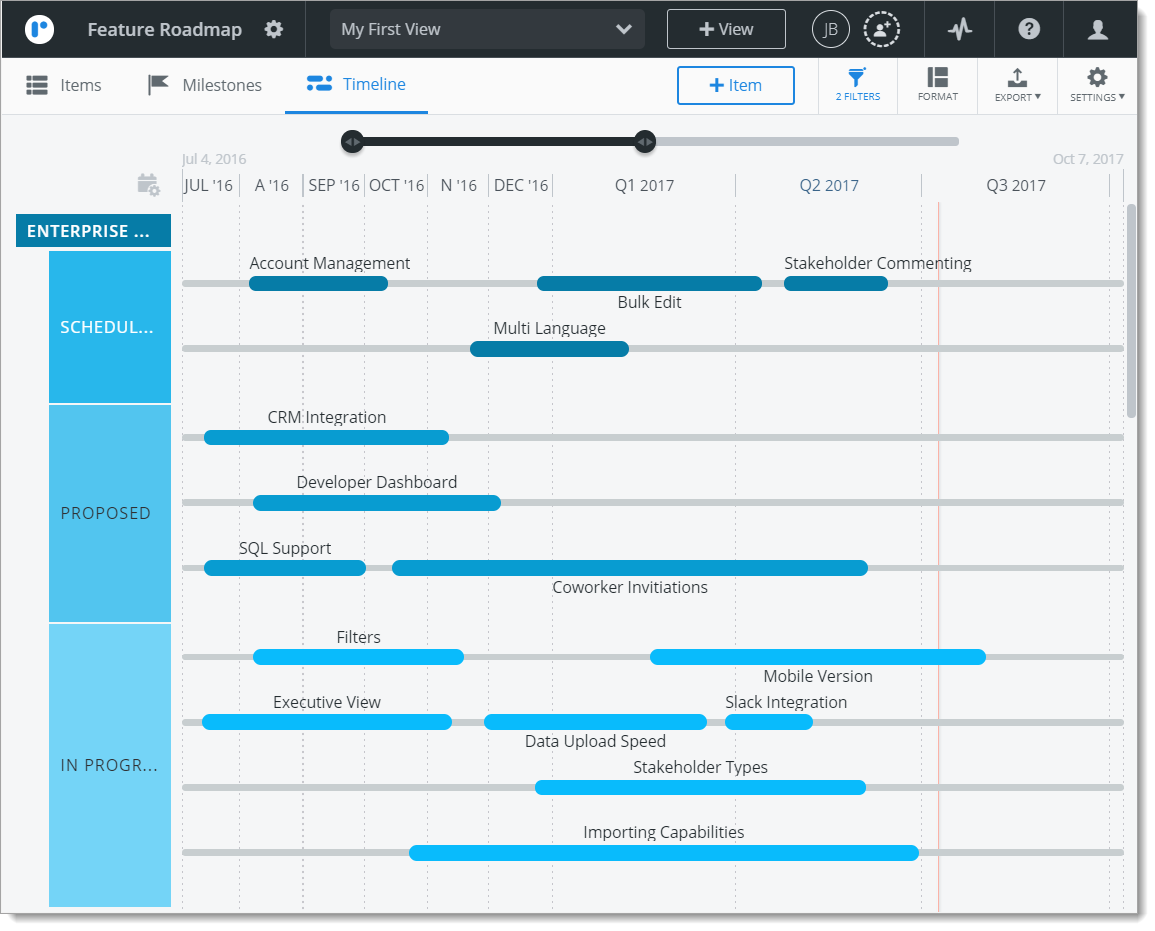
Timelines have three main areas or sections: 1) the time range, 2) items on the timeline, and 3) headers (additional pivots).
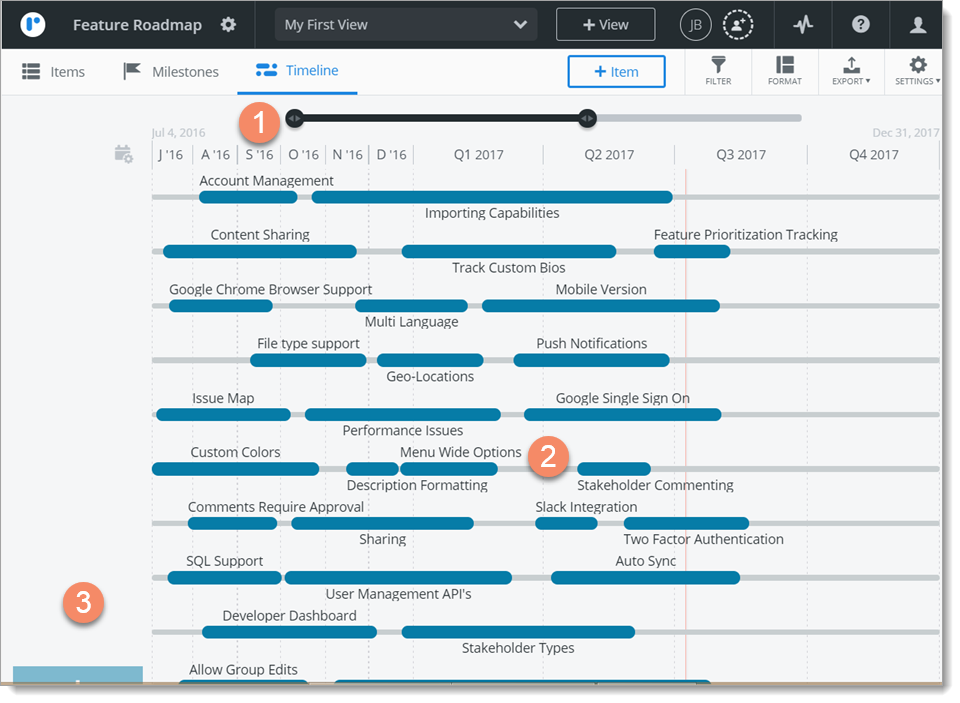
1. The time range
Because a Timeline is a time-oriented visualization of a roadmap, one of its main components is the time range represented by the horizontal timeline along the top.
Adjusting the timeline's scale
The first thing you'll notice about the timeline is the timeline slider. By dragging and dropping the slider or dragging the handles on either end along the timeline, you can zoom in or out on the timeline by adjusting the time range that is visible on the screen (the timeline's scale). As you drag the slider, the dates at either end of the timeline change. For more precision, you can click these to set the start and end of the range to exact dates.
Setting time periods
The next thing you'll notice about the timeline is that it's split up into time periods and that these extend down as dotted vertical lines to form the timeline's columns. If today's date falls within the timeline's scale, you'll see it as a red solid line. You can set each time period on the timeline separately by clicking it and selecting Months, Quarters, Halves, or Years in the Time Period dropdown. Which time periods you select will depend on the set scale of the timeline and the degree of detail that you want.
Limiting the timeline's date range
In addition to adjusting the timeline's scale, you can limit the date range of the entire timeline by setting its start and end dates. A timeline's date range determines two things: the items that are included in a Timeline (only those within the set date range) and the outer limits of the timeline slider. To set the limits of the timeline's date range, click the Date Preferences icon on the far left of the timeline, select a Start Date and an End Date under Date Settings in the dialog, and click Save.
2. Items on the timeline
The second major component of a Timeline is the horizontal bars representing the individual items in the roadmap. These item bars are plotted along grey horizontal streams spanning the timeline to reflect the item's date range.
Timelines start out with only the time pivot so, until you set up other pivots by adding headers (see below), the vertical arrangement of items is in no particular order. When headers are added, the streams on the Timeline are aligned with the headers along the left and the items are arranged on the streams accordingly.
Item labels
Each item on the timeline has a label above the bar. The default label is the item's Title (Items field in the Items Table).
Viewing item dates
As you saw above, only items that fall within the timeline date range are included in the Timeline, and only items that fall within the timeline scale are visible. To view an item's date range, mouse over the item's name on the Timeline.
Changing item dates
You can change an item's dates directly in a Timeline by dragging and dropping the item bar along its stream or dragging the handles on either end. As you drag the item bar, you'll see the dates changing.
Viewing and editing item details
To view and edit details of an item in the item card, click the item's label on the timeline.
3. Headers (additional pivots)
As you've seen so far, all Timelines start out with just the time pivot, which gives you only a one-dimensional view of your roadmap items. That's where Timeline headers come in.
Headers allow you to add another pivot to a Timeline by grouping items vertically on any field in the roadmap in addition to plotting them horizontally along a timeline. In fact, you can add both a header and a subheader to a Timeline in order to further organize items in each grouping by a second field.
Adding a header to a Timeline (primary pivot)
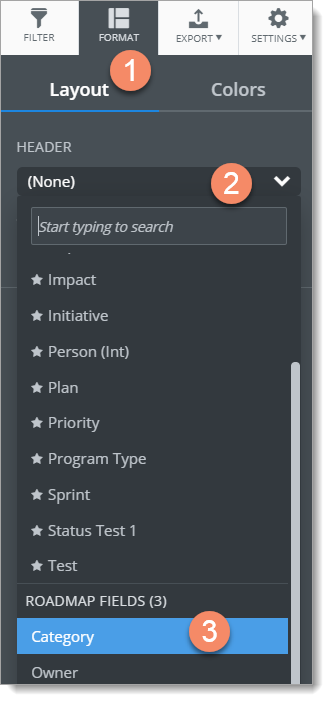
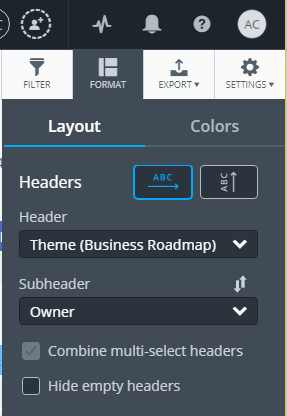
On the View navbar, click the Format icon.
In the Layout tab, click the Header dropdown.
In the dropdown, select the field you want to use for the timeline's main groupings (primary vertical pivot). For the tutorial, we're selecting Category.
Adding a subheader to a Timeline (secondary pivot)
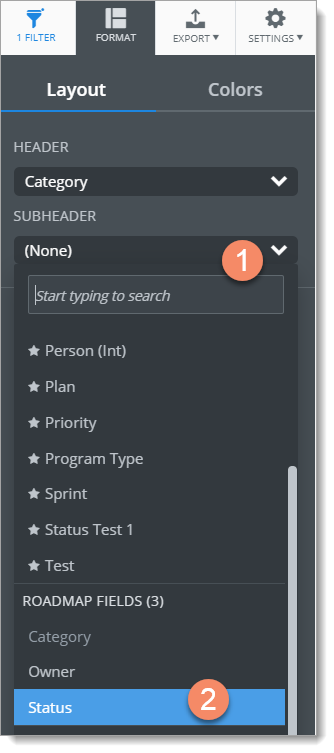
In the Layout tab, click the Subheader dropdown.
In the dropdown, select the field you want to use for the timeline's subgroupings (secondary vertical pivot). For the tutorial, we're selecting Status.
Click the Format icon to close the panel.
You should now see headers along the left side of the Timeline grouping items first by Category and then by Status.
Hiding empty headers
If an item has not been assigned a field value that you are trying to pivot by, it will show up on the roadmap as a stream labeled [Field Name] : None. In the case below, the item NPS Pilot has not yet been assigned a value from the Owner field, as a result it is placed in the stream labeled OWNER: None.
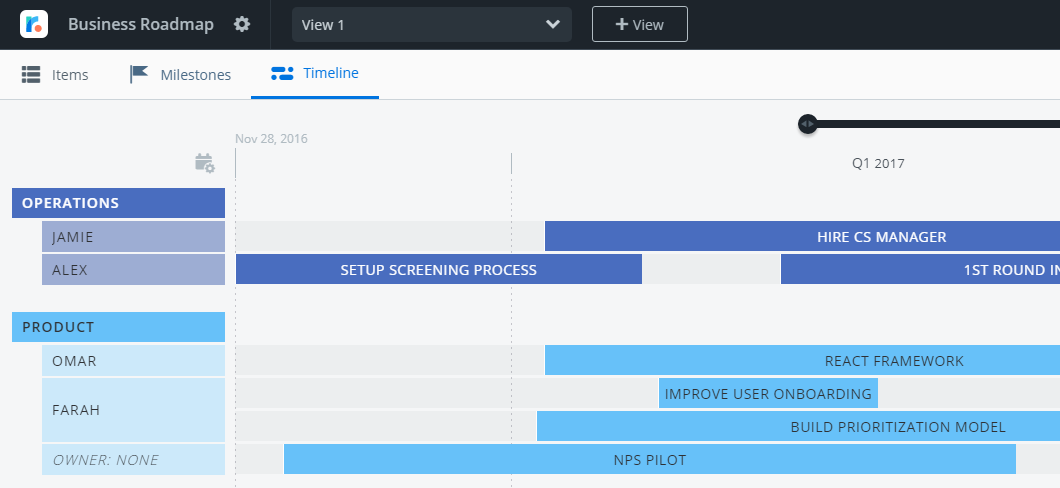
In order to hide empty headers:
Navigate to the Format tab.
Find the Hide empty headers checkbox.
Check the box to hide any empty headers on your roadmap.
Format Timeline layout and colors
Once you've selected and added pivot headers to your Timeline, you can format the layout and colors of the headers and items.
Formatting the layout
Adjust the header width
If you've added both headers and subheaders to your Timeline, there may not be enough space to view these properly. To widen the space for the header:
Mouse over anywhere along the right edge of the headers.
When the vertical blue bar appears, click and drag it to set the desired width.
Switch to the Condensed theme
Another way to provide more screen space for your Timeline is to switch from the default Original theme to the Condensed theme.
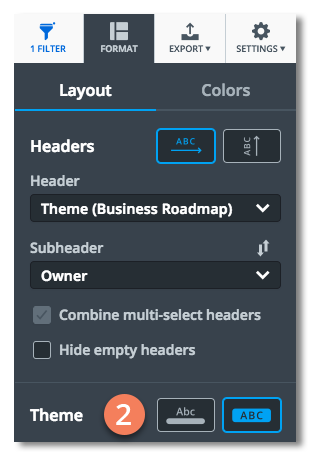
Open the Format panel again (Format icon on the View navbar).
Find the Theme label, select the Condensed theme icon.
NOTE: The Condensed theme works best with a Horizontal header orientation (see below).
Change header orientation
Another way to give your headers more space is to change the orientation of the main header. The default orientation is Horizontal.
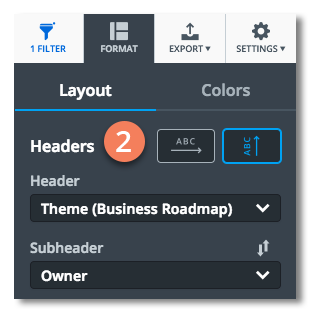
Open the Format panel again (Format icon on the View navbar).
Find the Headers label, select the Vertical orientation icon.
NOTE: The Vertical orientation works best with the Original theme (see above).
Formatting colors
You have two options when setting a Timeline's colors: Color By Base Color and Color By Field. The default setting is Color By Base using a range of blues.
Change the Base Color
You can choose a different color for the Base Color other than blue.
Open the Format panel again (Format icon on the View navbar).
Click the Colors tab.
Below the Color By dropdown, click the paint drop and select a new color.
Set Timeline colors to Color by field
In addition to making your Timeline more visually appealing, Color by Field allows you to create a color-based pivot in addition to the time pivot and headers.
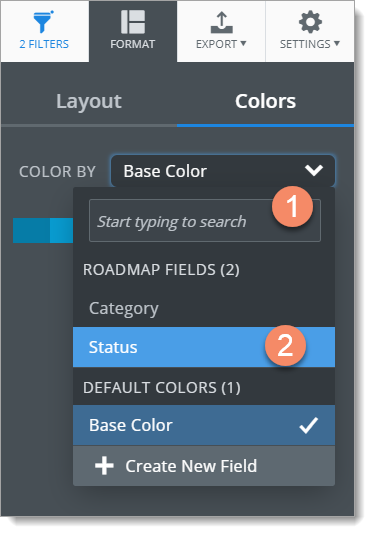
1. Still in the Colors tab, click the Color By dropdown.
2. In the dropdown, select the field you want to use for the color-based pivot. For the tutorial, we're selecting Status.
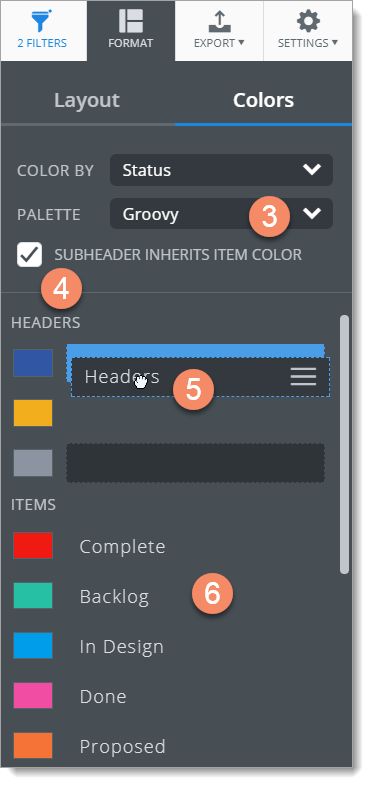
3. In the Palette dropdown, select the color palette you want to use. For the tutorial, we're selecting Groovy.
4. To make the colors of the Status subheaders match the colors you choose for the items in the Items section of the tab (see step 6), select Subheader Inherits Item Color below the Palette dropdown.
5. In the Headers section of the tab, drag and drop the Header label onto the color you want to apply to the Timeline's headers (Category).
6. In the Items section of the tab, drag and drop Status names onto colors to indicate how you want to color-code the items on the timeline.
7. Click the Format icon to close the panel.
You should now see the selected formatting applied to your Timeline.
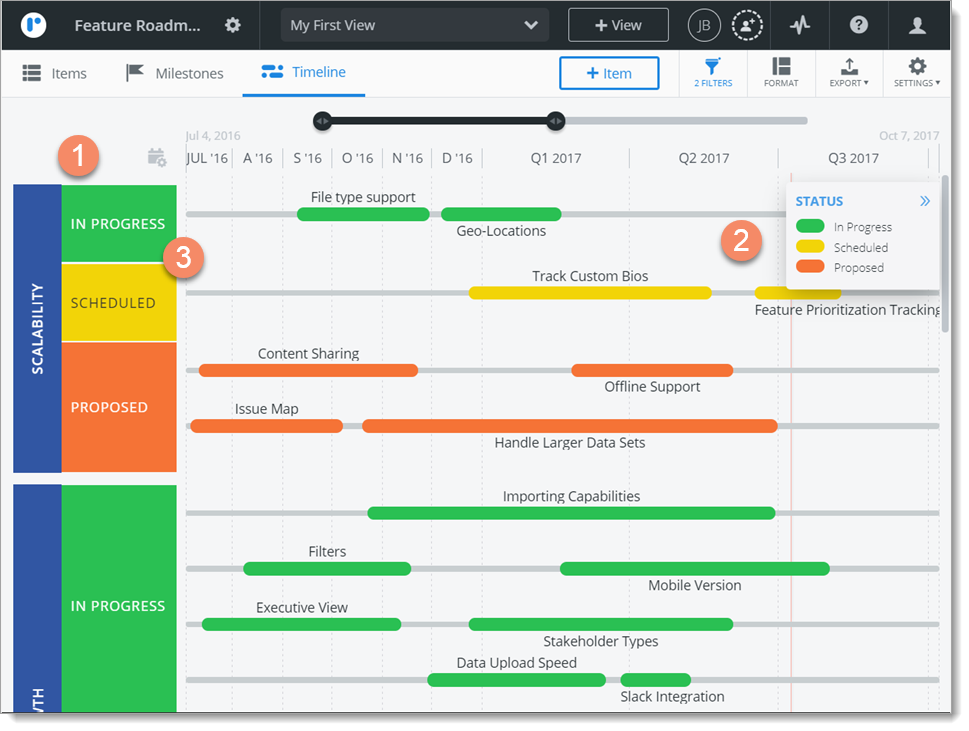
In the header column, you should see the selection of the Category field for the header pivot and of the Status field for the subheader. pivot. You should also see that the column has been widened and the header orientation has been set to Vertical.
In the Legend, you can see the selected color-coding makes it easy to identify the status of each item on the timeline.
In the header column, you can also see that the subheaders (Status) inherit (match) the colors selected for the items.
Next Step
Step 7 - Create a Swimlane Visualization