Step 7 - Create a Swimlane Visualization
Swimlanes vs. Timelines
You've seen how Timelines are the best choice when you want to present a time-oriented view of roadmapped items like initiatives and objectives. But when you're working with an agile theme-based roadmap, you need a more dynamic type of visualization that allows you to plot items on a dynamic grid and pivot data in multiple ways. That's where Swimlanes come in.
Swimlanes and views
Just like Timelines, to create a Swimlane for a roadmap, you create a new view for the roadmap and then create the Swimlane visualization associated with the view. A roadmap can have multiple views and therefore multiple Swimlanes and Timelines. Each roadmap view has its own Swimlane or Timeline, filterset, and data pivots. If a roadmap has milestones, they are visible only on Timelines.
Creating a Swimlane visualization
To create a Swimlane visualization for a roadmap you create a new roadmap view, selecting Swimlane as the view's visualization.
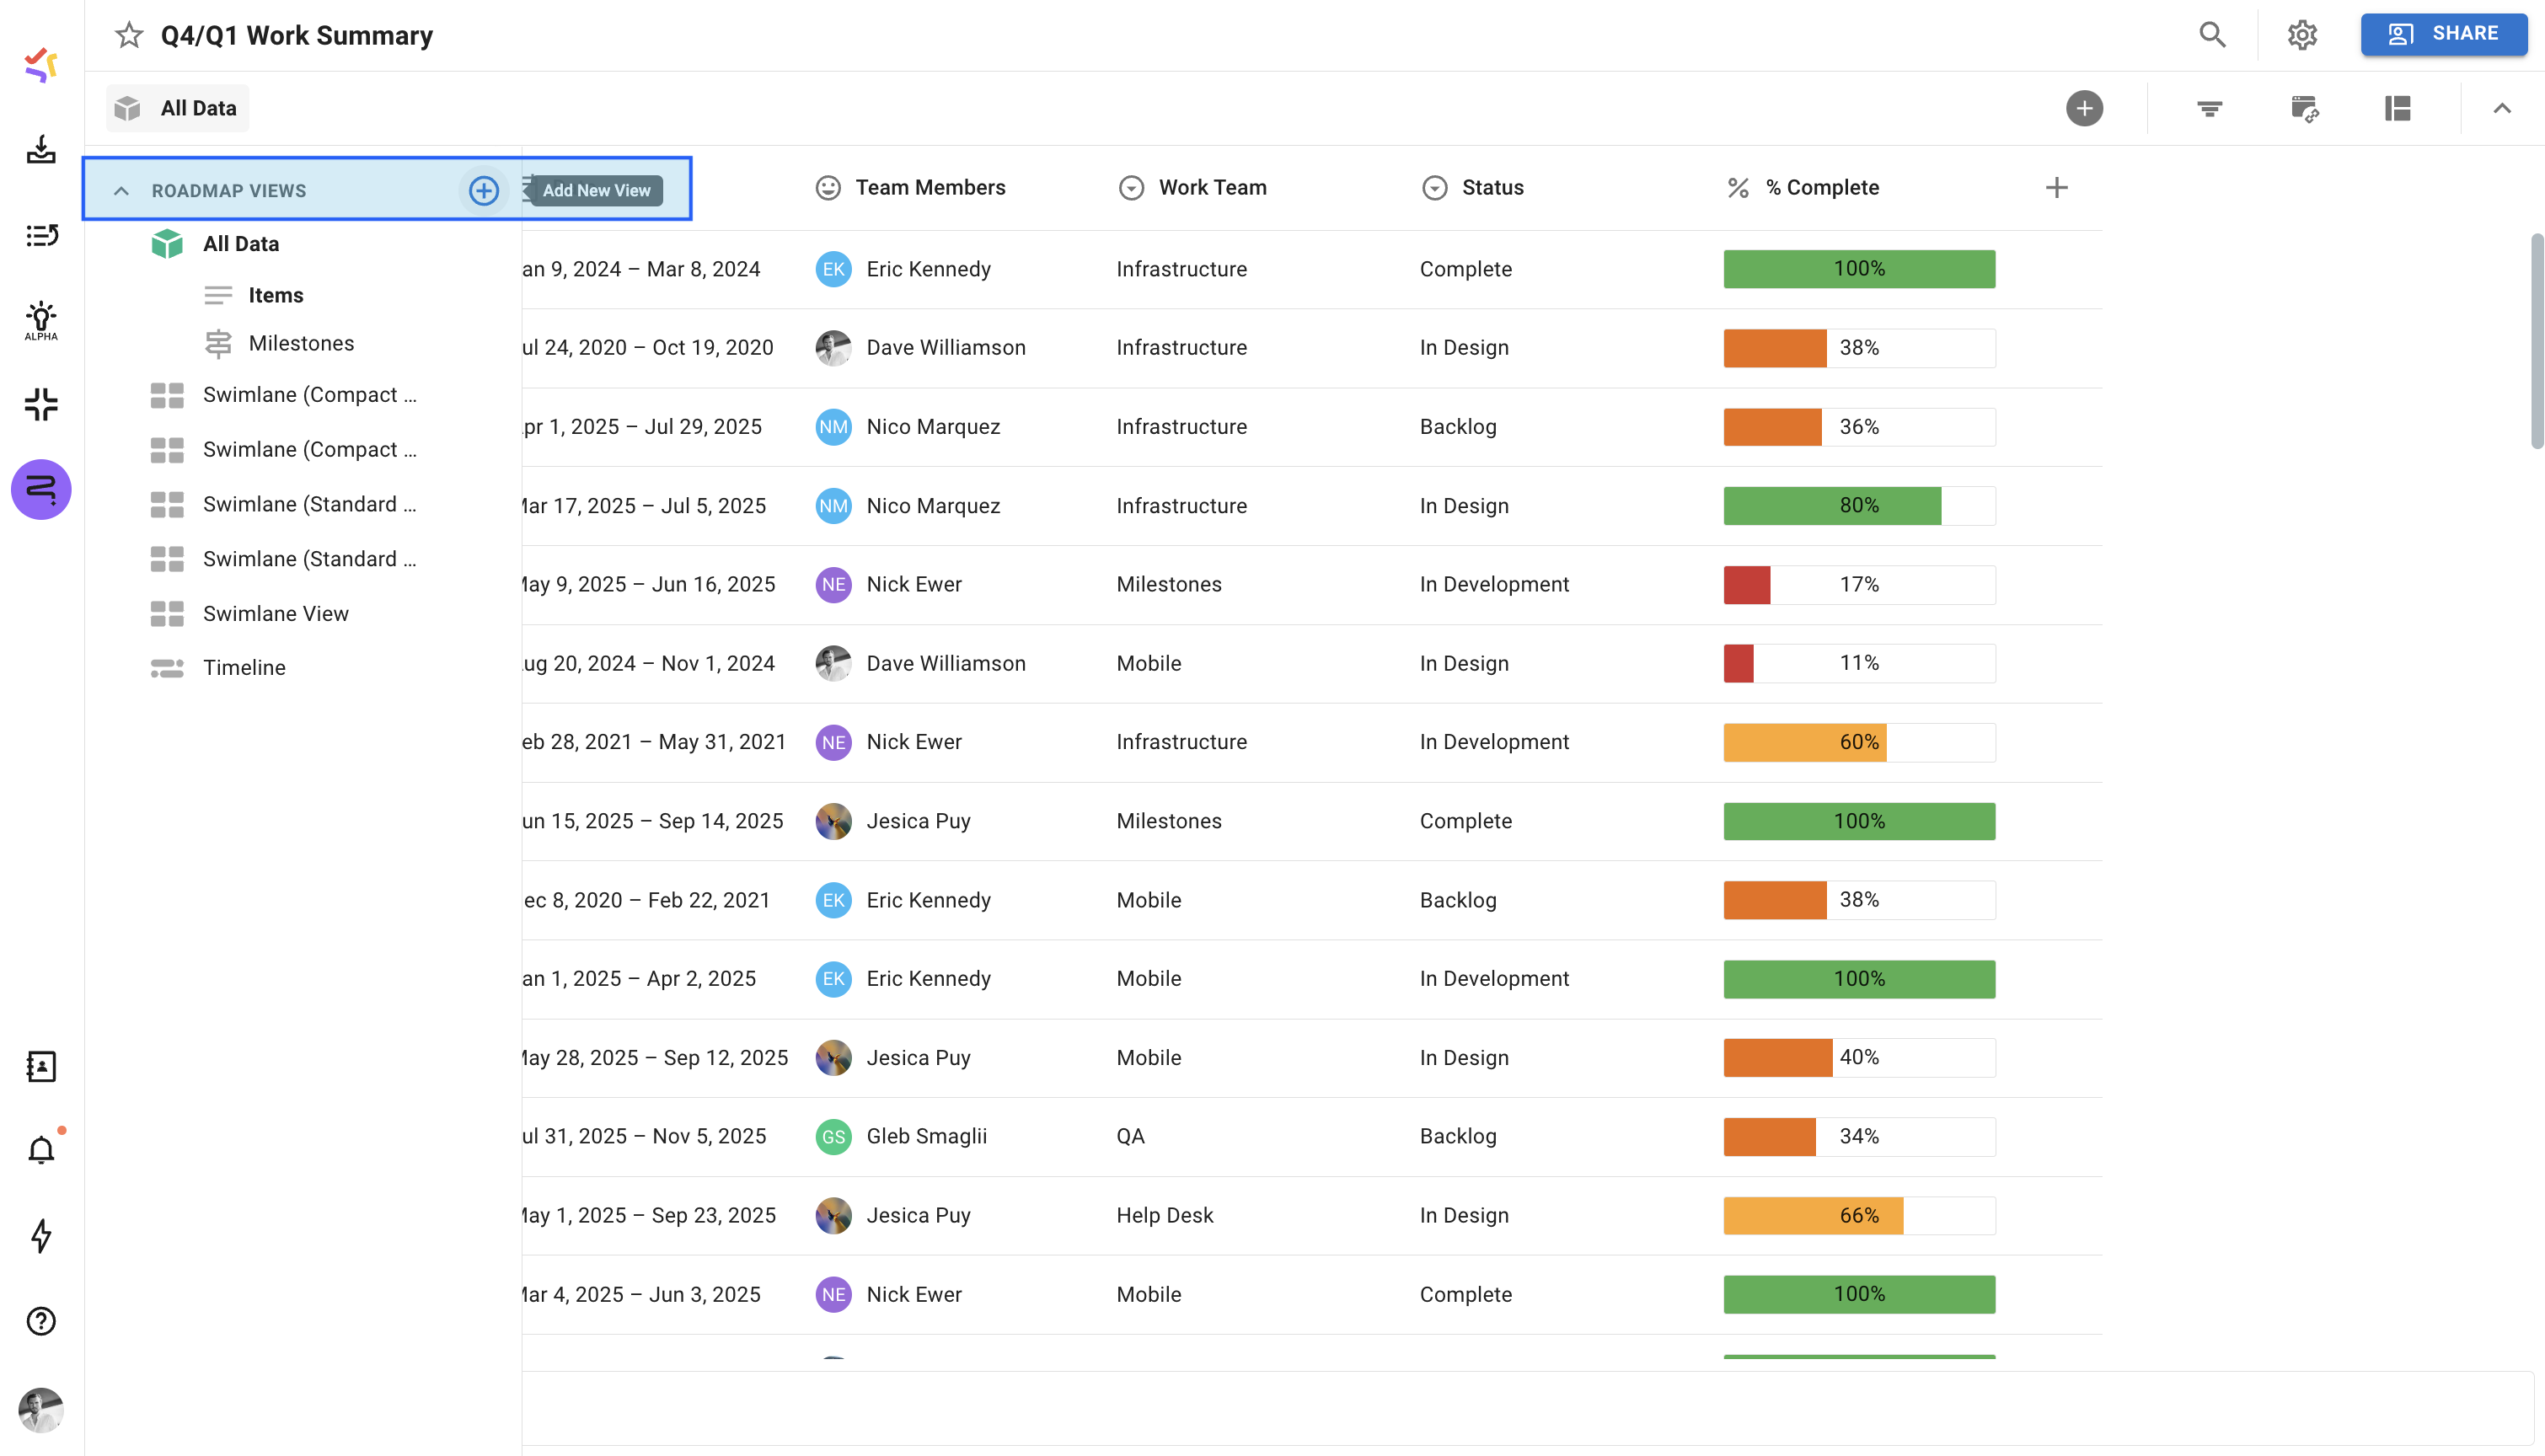
When starting from a roadmap that doesn’t yet have views, or may require additional views to be created:
Click into the Viewfinder Panel, located directly beneath the roadmap name.
Once the panel is open, click on the Add New View button in the top-right.
In the New View setup window:
Add a Title for the view
Select Swimlane as the Visualization Type
If you have other views already built, you can copy the filters from them during this step.
Once ready, click the Create button to save the settings and navigate to the Swimlane.
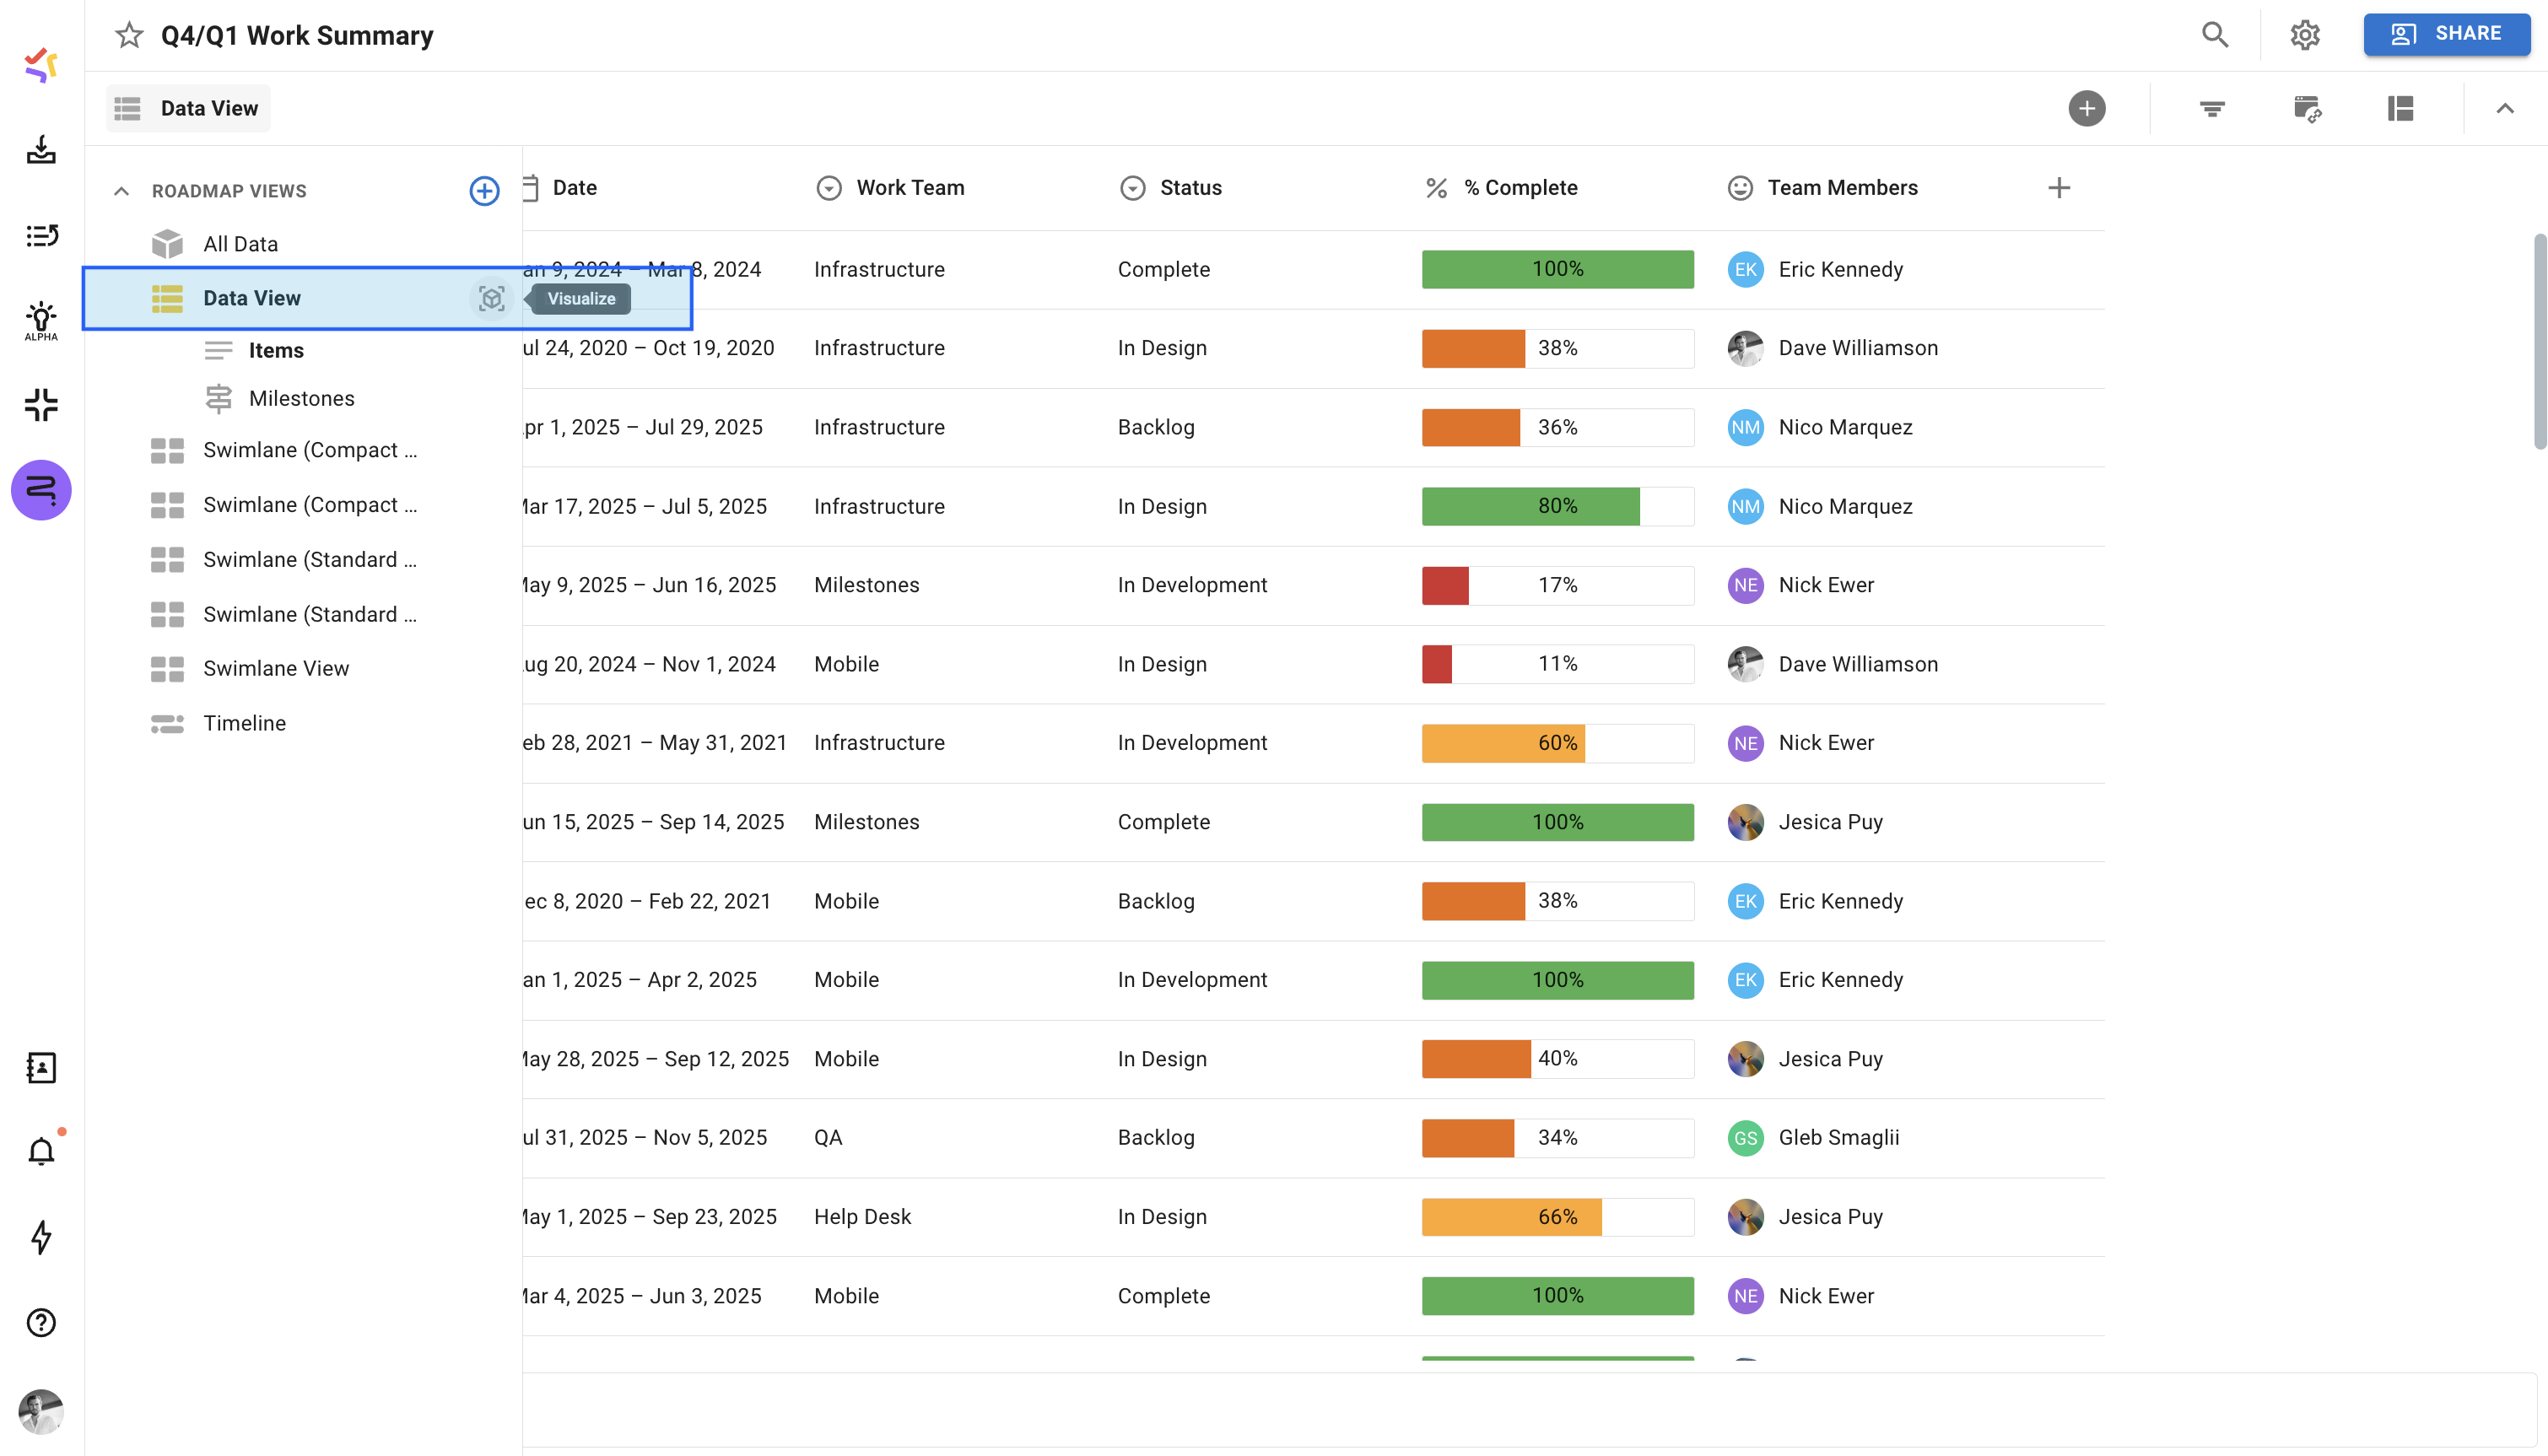
If you’ve already created a Table View in your roadmap and have not yet visualized it:
From the view you wish to visualize, click into the Viewfinder Panel.
Click into the Visualize icon to the right of the view’s name.
In the New Visualization setup window
Select Swimlane as the Visualization Type
Once ready, click the Create button to save the changes and navigate to the Swimlane.
1. The column header
The column header serves as the Swimlane's horizontal pivot. Unline Timelines, which have time as a fixed horizontal pivot, Swimlanes allow you to customize the horizontal pivot by selecting the field you want to use for the column header.
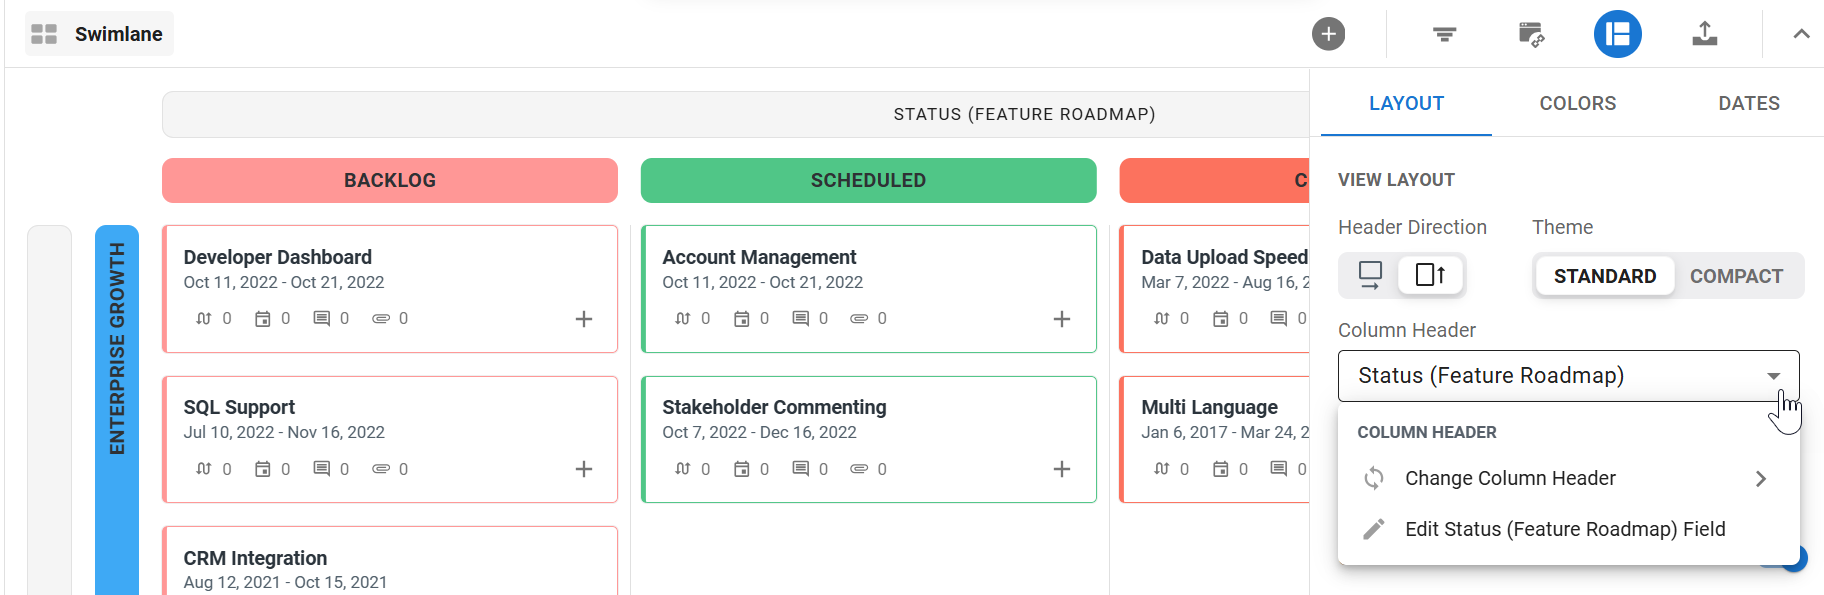
Change the Swimlane header
To change the column headers:
On the View navbar, click the Format icon.
In the Layout tab, click the Column Header dropdown.
In the dropdown, select Change Column Header.
You can choose to use an existing field, use item dates, or create a new field for the header.
2. The row header
The row header serves as the Swimlane's vertical pivot. Unlike Timelines, Swimlanes have a single vertical header. Like the column header, you can select any field in the roadmap for the row header.
Add the row header
Still in the Layout tab, click the Row Header dropdown.
In the dropdown, select the field you want to use for the vertical pivot.
3. Items on the Swimlane
Swimlane items are color-coded and matrixed on the Swimlane's grid in alignment with the column and row headers.
Item Labels
The default label for items on a Swimlane is the item's Title (Items field in the Items Table).
Formatting Swimlane layout and colors
Once you've selected and added column and row headers to your Swimlane, you can format the layout and colors of the headers and items.
Format the layout
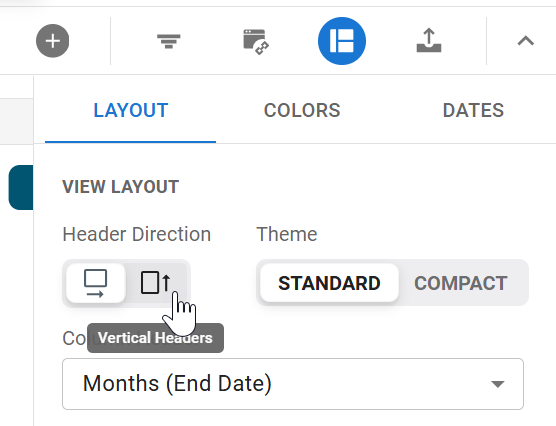
Changing header orientation
You can change the orientation of your Swimlane's row headers if you need more space to display field names. The default orientation is Horizontal.
Still in the Layout tab, find the Header Direction setting.
Select the Vertical Headers icon.
Showing empty headers
By default, heading values that don’t have any items matching them, will not be displayed. For example, if you are using the Status field for your header, and no items are in a DONE status, the DONE status will not be shown in your header.
To show empty headers:
Still in the Layout tab, find the Show Empty Headers setting
Enable this setting.
Format colors
You have two options when setting a Swimlane's colors: Color By Base Color and Color By Field. The default setting is Color By Base using a range of blues.
Changing the Base Color
You can choose a different color for the Base Color other than blue.
Open the Format panel again (Format icon on the View navbar).
Click the Colors tab.
Below the Color By dropdown, click the paint drop and select a new color.
Setting Swimlane colors to Color by field
In addition to making your Swimlane more visually appealing, Color by Field allows you to create a color-based pivot in addition to the row and column header pivots.
Still in the Colors tab, click the Color By dropdown.
In the dropdown, select the field you're using for the column header pivot.
In the Palette dropdown, select the color palette you want to use. For the tutorial, we're sticking with the default Citrus palette.
To make the colors of the column headers match the colors you choose for the items in the Items section of the tab, select Column Header Inherits Item Color below the Palette dropdown (see step 6).
In the Headers section of the tab, drag and drop the Header label onto the color you want to apply to the row headers. If you choose not to match the column headers with the items (see step 4), they will also use this color.
In the Items section of the tab, drag and drop column header field values onto the color to indicate how you want to color-code the items on the Swimlane.
Click the Format icon to close the panel.
You should now see the selected headers and formatting applied to your Swimlane.
