Dashboard Gadgets
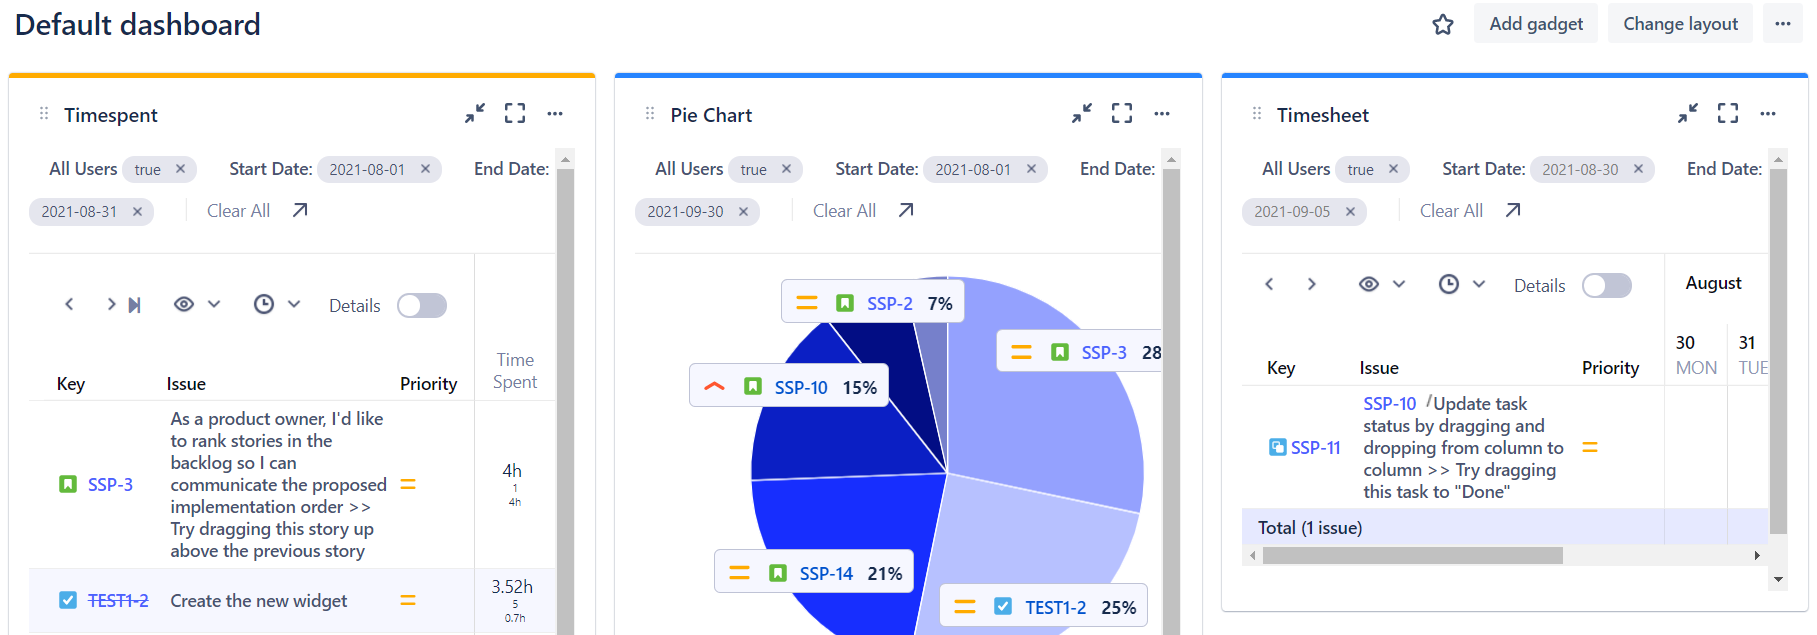
Time Tracker allows you to configure your Jira dashboards to quickly see and track Timesheet reports. Jira dashboards provide a convenient way to visually monitor and interact with multiple reports at the same time. Use the Jira dashboard settings to set up the look of your dashboard. For example, in the Change layout setting, you can select a Three columns view:
To add a gadget to a Jira Dashboard:
On your Jira dashboard, click Add gadget at the top right.
Type Prime in the Search box to narrow the selection, and then select Add Gadget beside Timesheet.
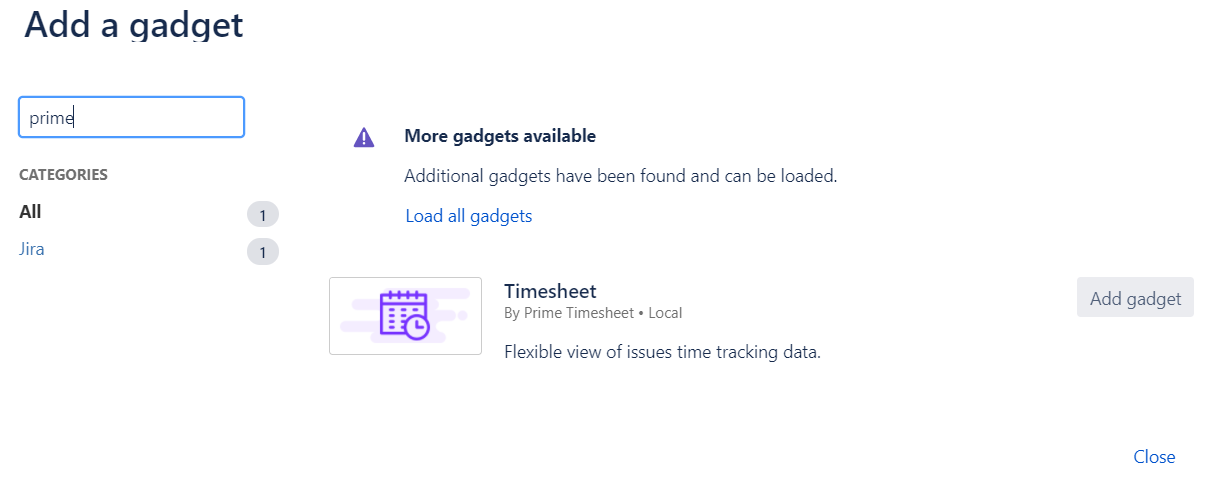
You can add multiple gadgets by repeating this step. The gadgets can be configured once you are back on the Jira dashboard.
When you are finished, click Close.
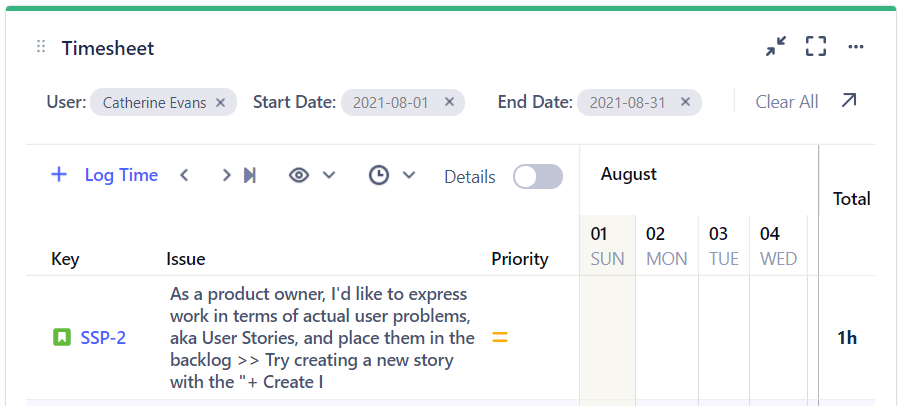
The Timesheet gadget is displayed on your dashboard and is ready for you to configure.
To configure a gadget:
Once you have added a Timesheet gadget to the Jira dashboard (see procedure above), click the more menu at the top-right of the gadget (…), and select Configure.
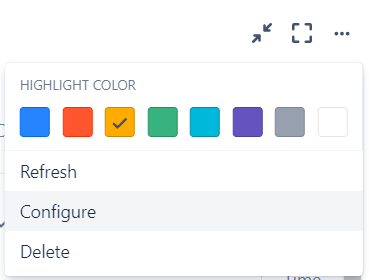
From this gadget menu, you can also set a highlight color for the gadget on the dashboard, as well as refresh or delete the gadget.
From the Report dropdown list, select the report that you want to display.
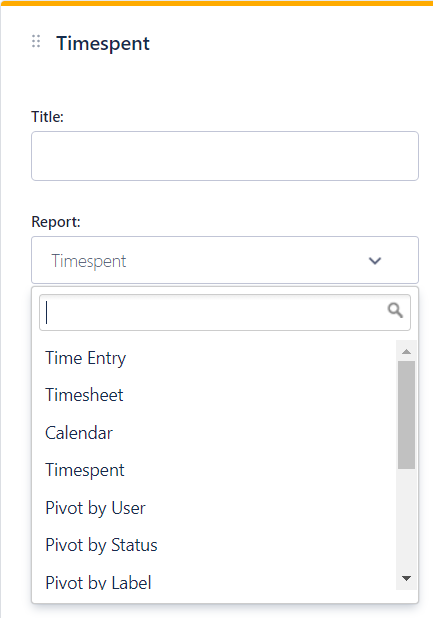
(Optional) Add a title and edit any other report settings.
Click Save at the bottom of the settings.
Once the gadget is set up, you can interact with the report directly in the dashboard. For example, in the Timesheet gadget, you can log time or access issues. If you need to access the full report page, click the Open report page arrow.