Time Reports Gadgets
Time Reports gadgets for Jira Server and Data Center allow you to configure your Jira dashboards to quickly see and track your time reports. Jira dashboards provide a convenient way to visually monitor and interact with multiple reports at the same time. Use the Jira dashboard settings to set up the look of your dashboard.
To add Time Reports Gadgets to a Jira Dashboard:
Navigate to Administration > System > User Interface > System Dashboard.
Click Add gadget.
Type Time Reports in the Search box to narrow the selection, and then select Add gadget beside the result.
You can add multiple Time Reports gadgets by repeating this step. The gadgets can be configured once you are back on the Configure System Dashboard page.
For each Time Reports gadget that you added, select the Report to be viewed, and optionally a title and edit any other report settings.
Click Save.
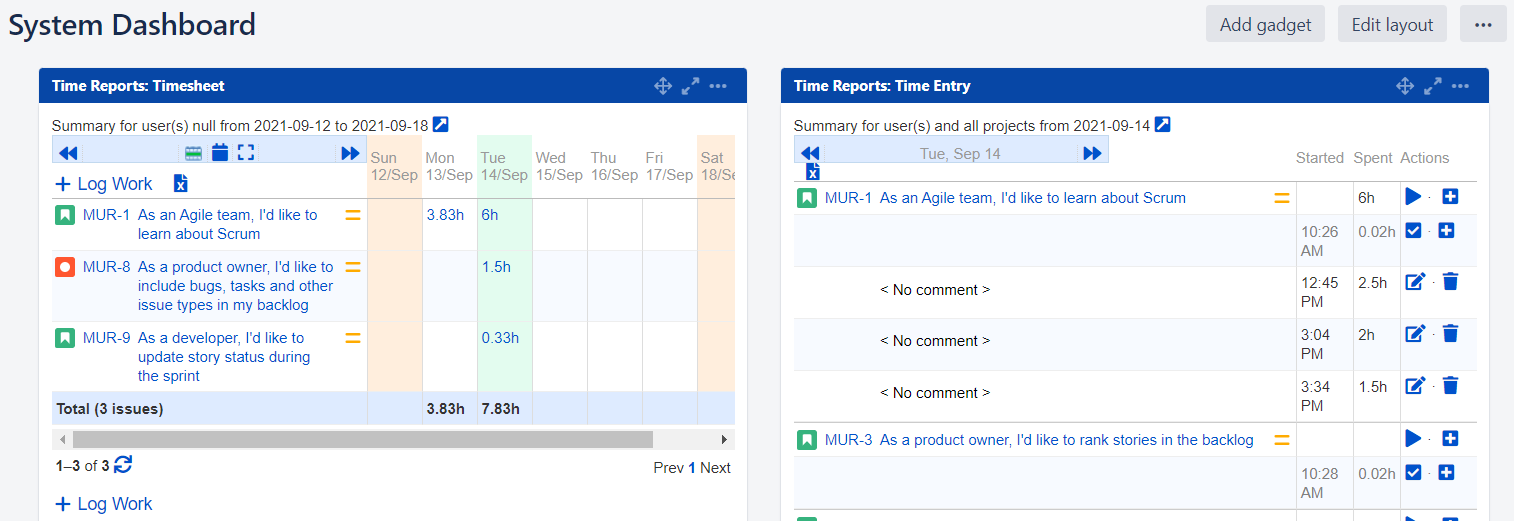
Once you return to the dashboard, the Time Reports gadget is displayed.
Once the gadget is set up, you can interact with the report directly in the dashboard.
For example, in the Timesheet gadget, you can log time or access issues.
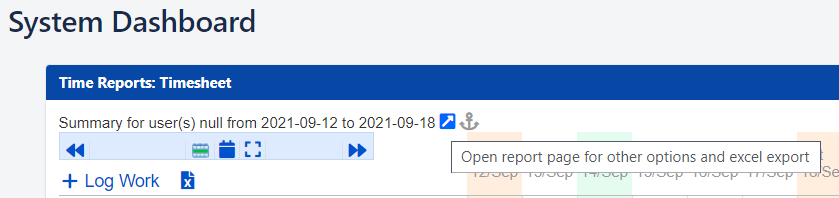
If you need to access the full report page, click the Open report page arrow .