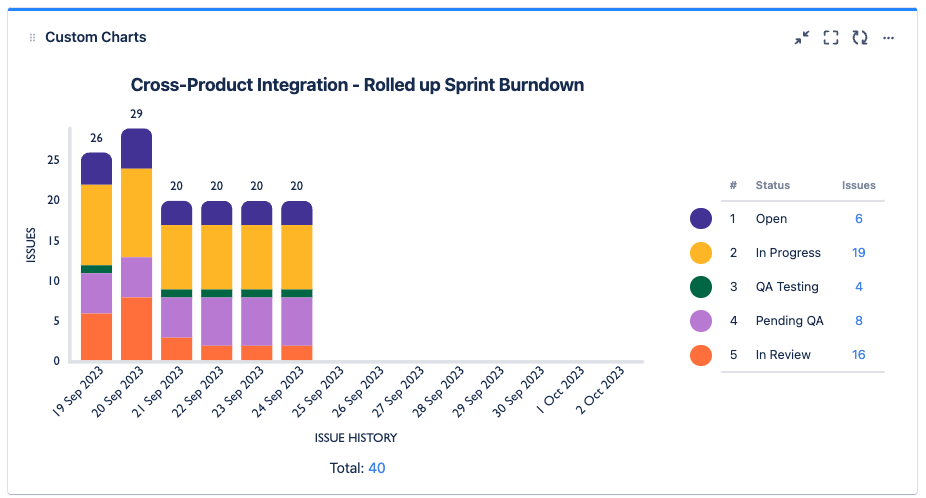
Track your project in Structure, and then create a burndown chart using our Custom Charts integration.
The following guide requires Custom Charts for Jira. If you don't have Custom Charts, you can try it for free.
Build Your Structure
If you already have a structure for your project, skip ahead to step two. If not, the following resources can help:
-
Building a Structure in Speed Mode
-
Building a Structure with Generators
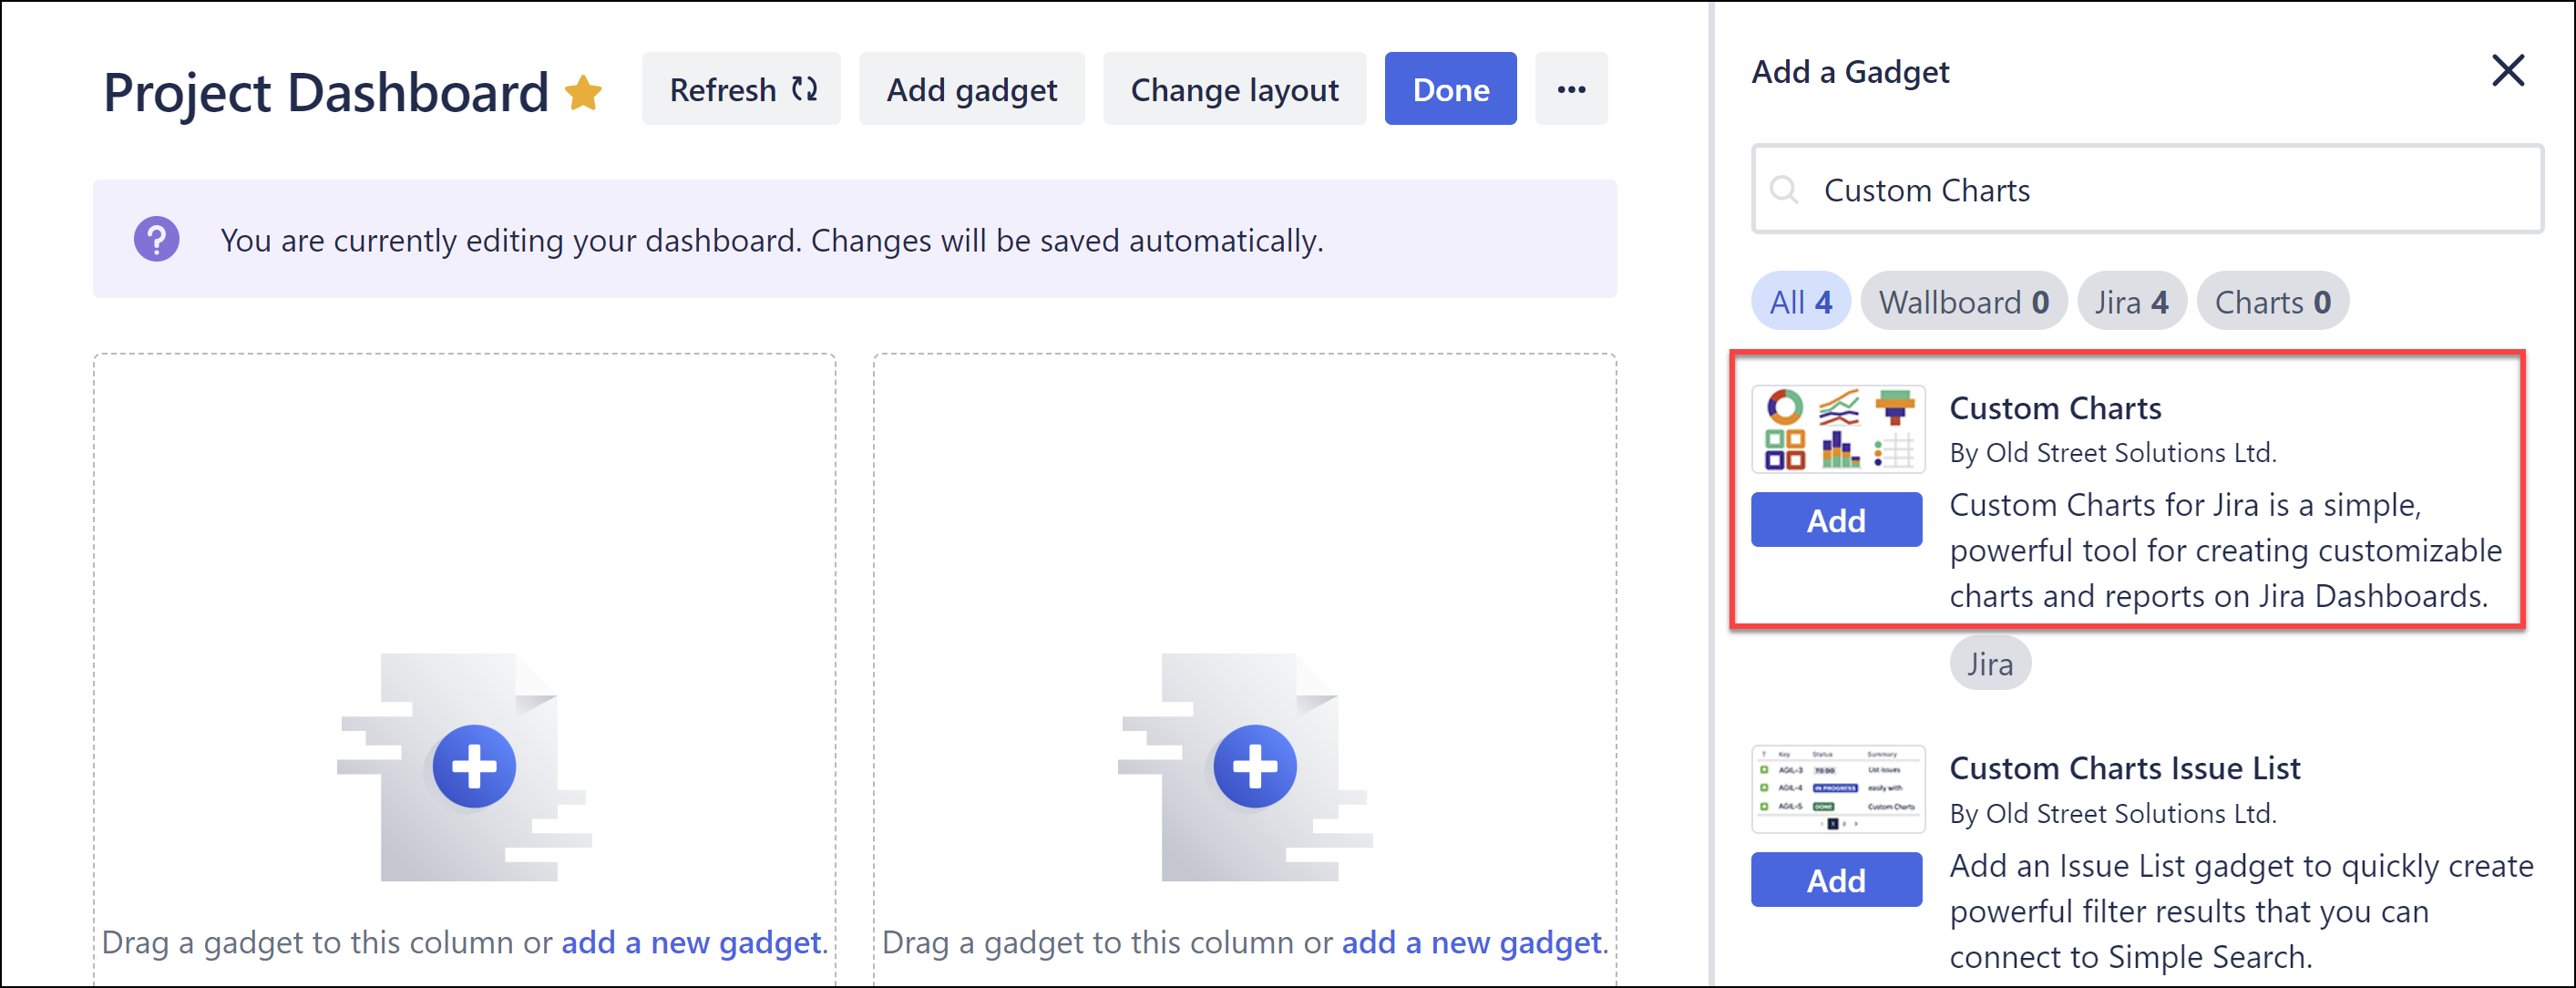
Add a Custom Chart to the Dashboard
-
Open your dashboard (or create a new one).
-
Select add a new gadget and search for Custom Charts in the gadget list.
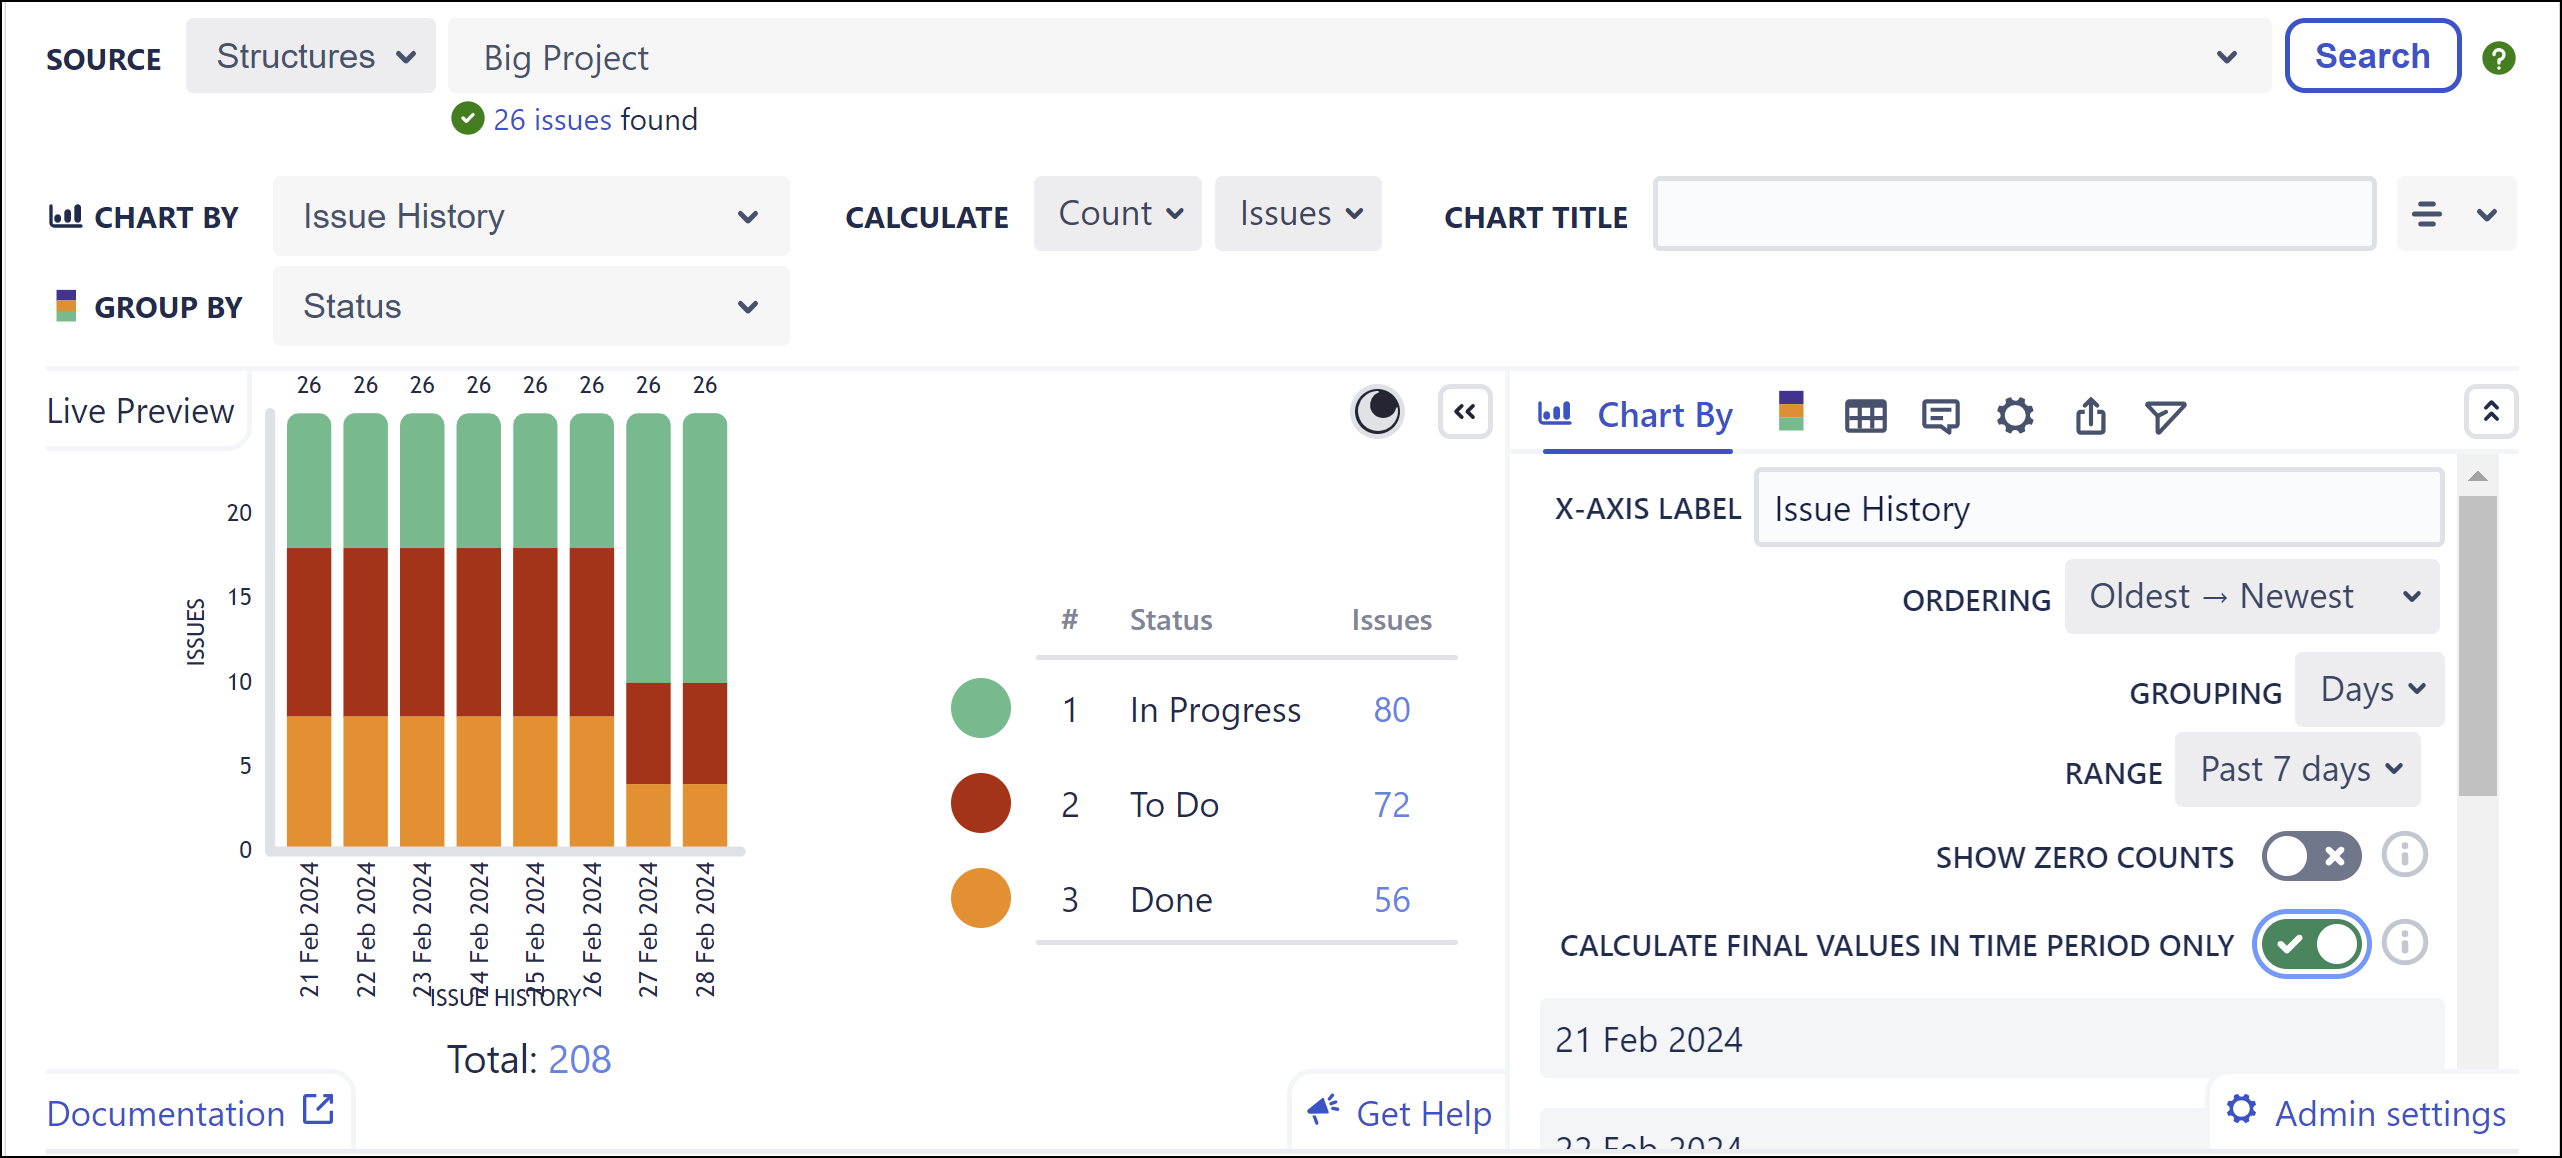
Configure the Custom Chart
Configure the chart with the following settings:
-
Type: 2D Stacked Bar Chart
-
Source: select Structure and search for your project structure
-
Chart by: Issue History
-
Group by: Status
-
In the Chart by tab, enable Calculate final values in time period only toggle
-
OPTIONAL: update the Grouping and Range settings to customize the appearance and dates for the chart
Need to add the chart to a Confluence page? Try Custom Charts for Confluence