Comparing Actual KPIs versus Projected KPIs
Financial Manager projects are calculated based on logged time and planned time in Tempo, providing actual and projected metrics in a granular view that demonstrates how projects are performing and how much they are costing.
This enables project managers to monitor the current progress and future projections by comparing actual KPIs versus projected KPIs, and to adjust any present or future costs to stay within the allocated budgets.
Plans with Generic Resources are not supported in Planner integration and forecasting.
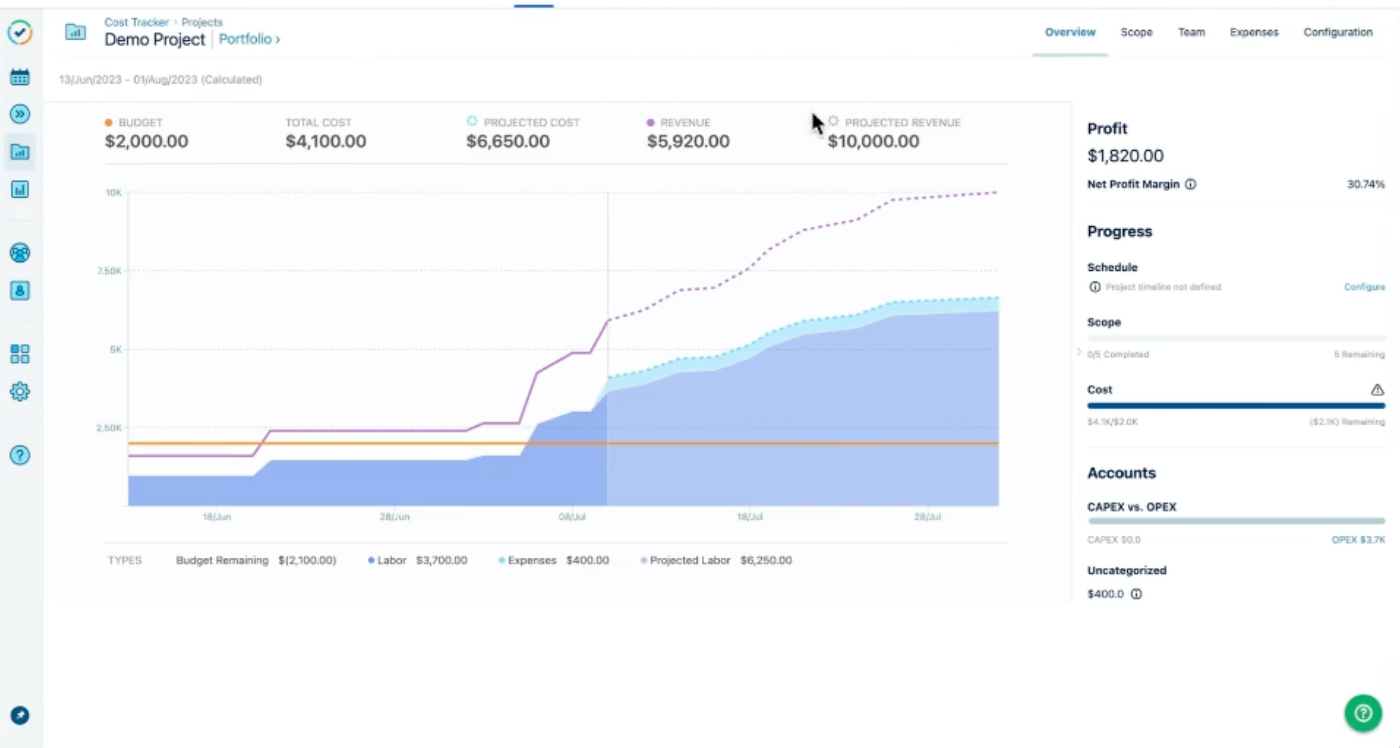
A Project Cost Management Overview
The project Overview presents the current KPIs and the projected KPIs that aim to monitor the progress of the projects. The project timeframe covers the dates for all worklogs and planned tasks for the project.
When importing project data, all logged time and planned time is imported for the selected Jira filter. For calculated timeframes, the date range considers the dates covering both the actual data and the projected data. Actual data signifies time logged against project tasks, and projected data signifies time planned against upcoming tasks.
For Time-based projects, similar KPIs are displayed in Time units per minute; however, only time-based related metrics are shown.
To compare the project overview KPIs:
Select a project.
Click the Overview tab.
Hover over the chart to read the breakdown.
The Overview chart is divided into two parts separating the Actual data from the Projected data. The legends and tooltips can help identify the differences.
Name | Description |
|---|---|
Budget | The amount of the budget allocated for the project as entered on the Configuration page. It is shown as an orange line in the Overview chart and matches the orange icon next to Budget. |
Total Cost | The total labor plus the total expenses. |
Projected Cost | The total cost plus the total remaining cost, shown in the chart as a turquoise dashed line. |
Revenue | Shown in the chart as a solid purple line, Revenue only appears if revenue tracking is enabled on the Configuration page. |
Projected Revenue | The total revenue (based on logged time) plus the total remaining revenue (based on planned time), shown as a purple, dashed line. |
Budget Remaining | The budget minus the total cost. |
Labor | The number of hours logged by team members at the defined rate, shown in dark blue color. |
Expenses | The fixed expenses for the projects, shown in light blue color. |
Profit | The profit and the net profit margin appear if revenue tracking is enabled. |
Projected Labor | The calculated labor plus the total remaining cost. |
Comparing the Project Scope KPIs
The project scope presents the project's actual and projected labor costs. The scope's timeframe is automatically generated based on the actual logged hours that the project team members have logged, and on their planned time for upcoming tasks. The logged time and planned tasks are related to the issues in the project.
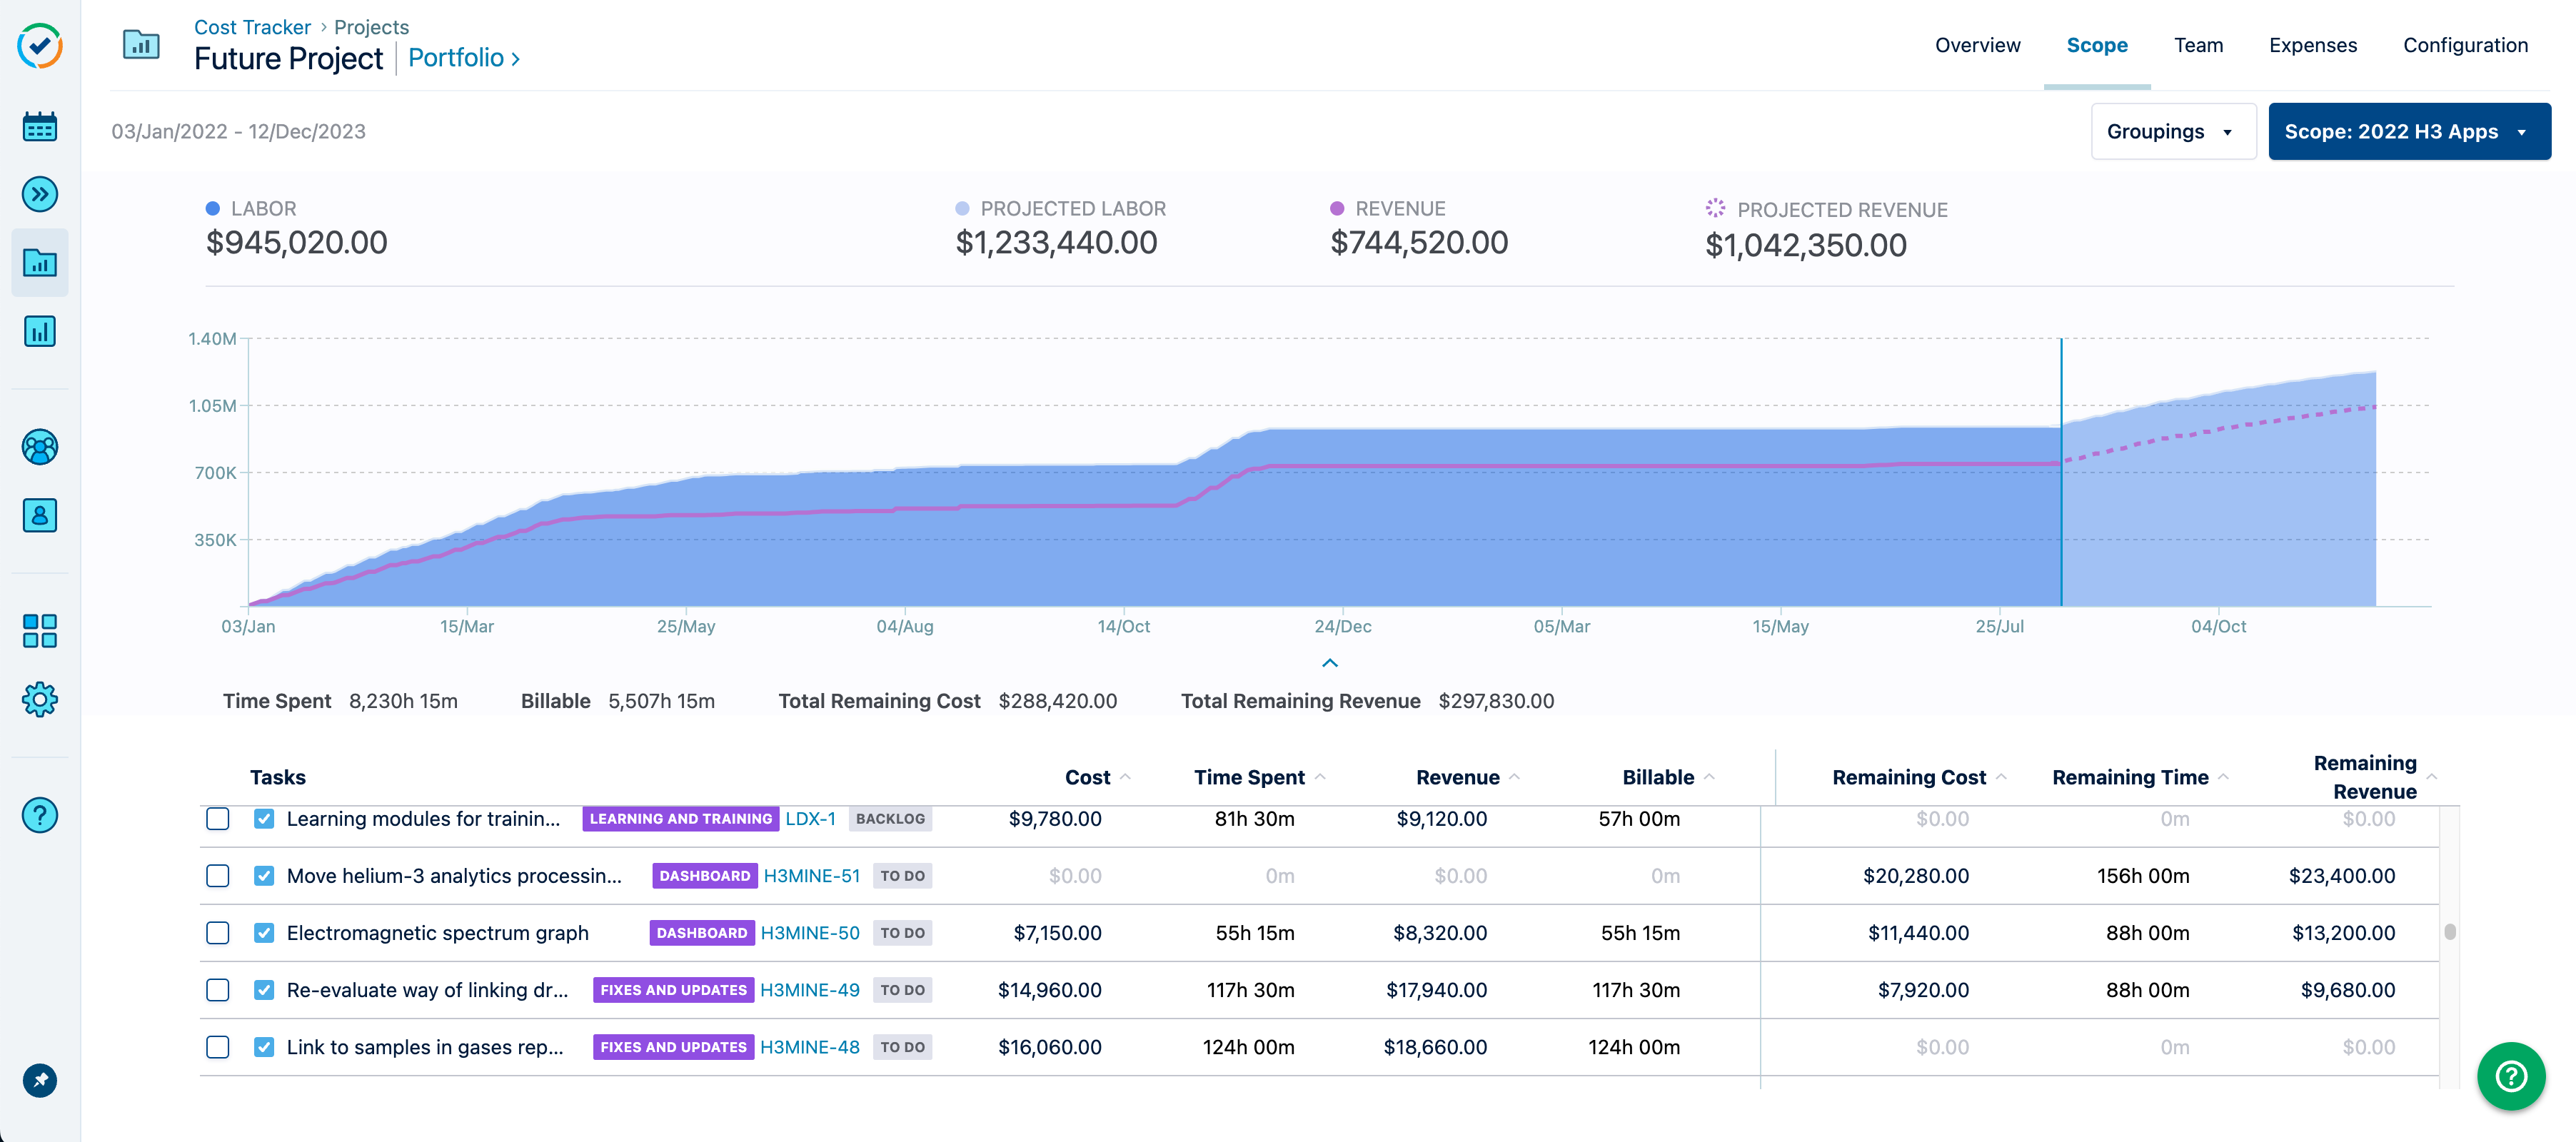
The Scope chart is divided into two parts, presenting the current and the projected values for labor and revenue, separated by a vertical line that represents today's date. The legends and tooltips can help identify the differences. Hover over the chart to read the breakdown for the:
Actual Labor and Revenue
Projected Labor and Projected Revenue
To compare the project scope KPIs:
Select a project.
Click the Scope tab.
If there are changes made to the holiday scheme or the workload scheme, then the plans are updated in Tempo Planner which automatically updates the projected labor and projected revenue for the Financial Manager projects.
Name | Description |
|---|---|
Labor Cost | The cost based on the number of hours logged by team members at a defined rate per role. |
Time Spent | The total number of hours logged by all team members to the project within the charted timeframe. |
Revenue | Revenue is based on the number of hours logged by project team members at the defined billing rate. |
Billable | The number of hours logged to which the billing rate applies. |
Total Remaining Cost | The total cost based on the planned hours and the remaining time after the current date and until the end of the time period within the charted timeframe, by all team members at the defined rate per role. |
Total Remaining Revenue | The revenue based on the number of planned hours and the remaining time after the current date and until the end of the time period within the charted timeframe, by project team members at the defined billing rate. |
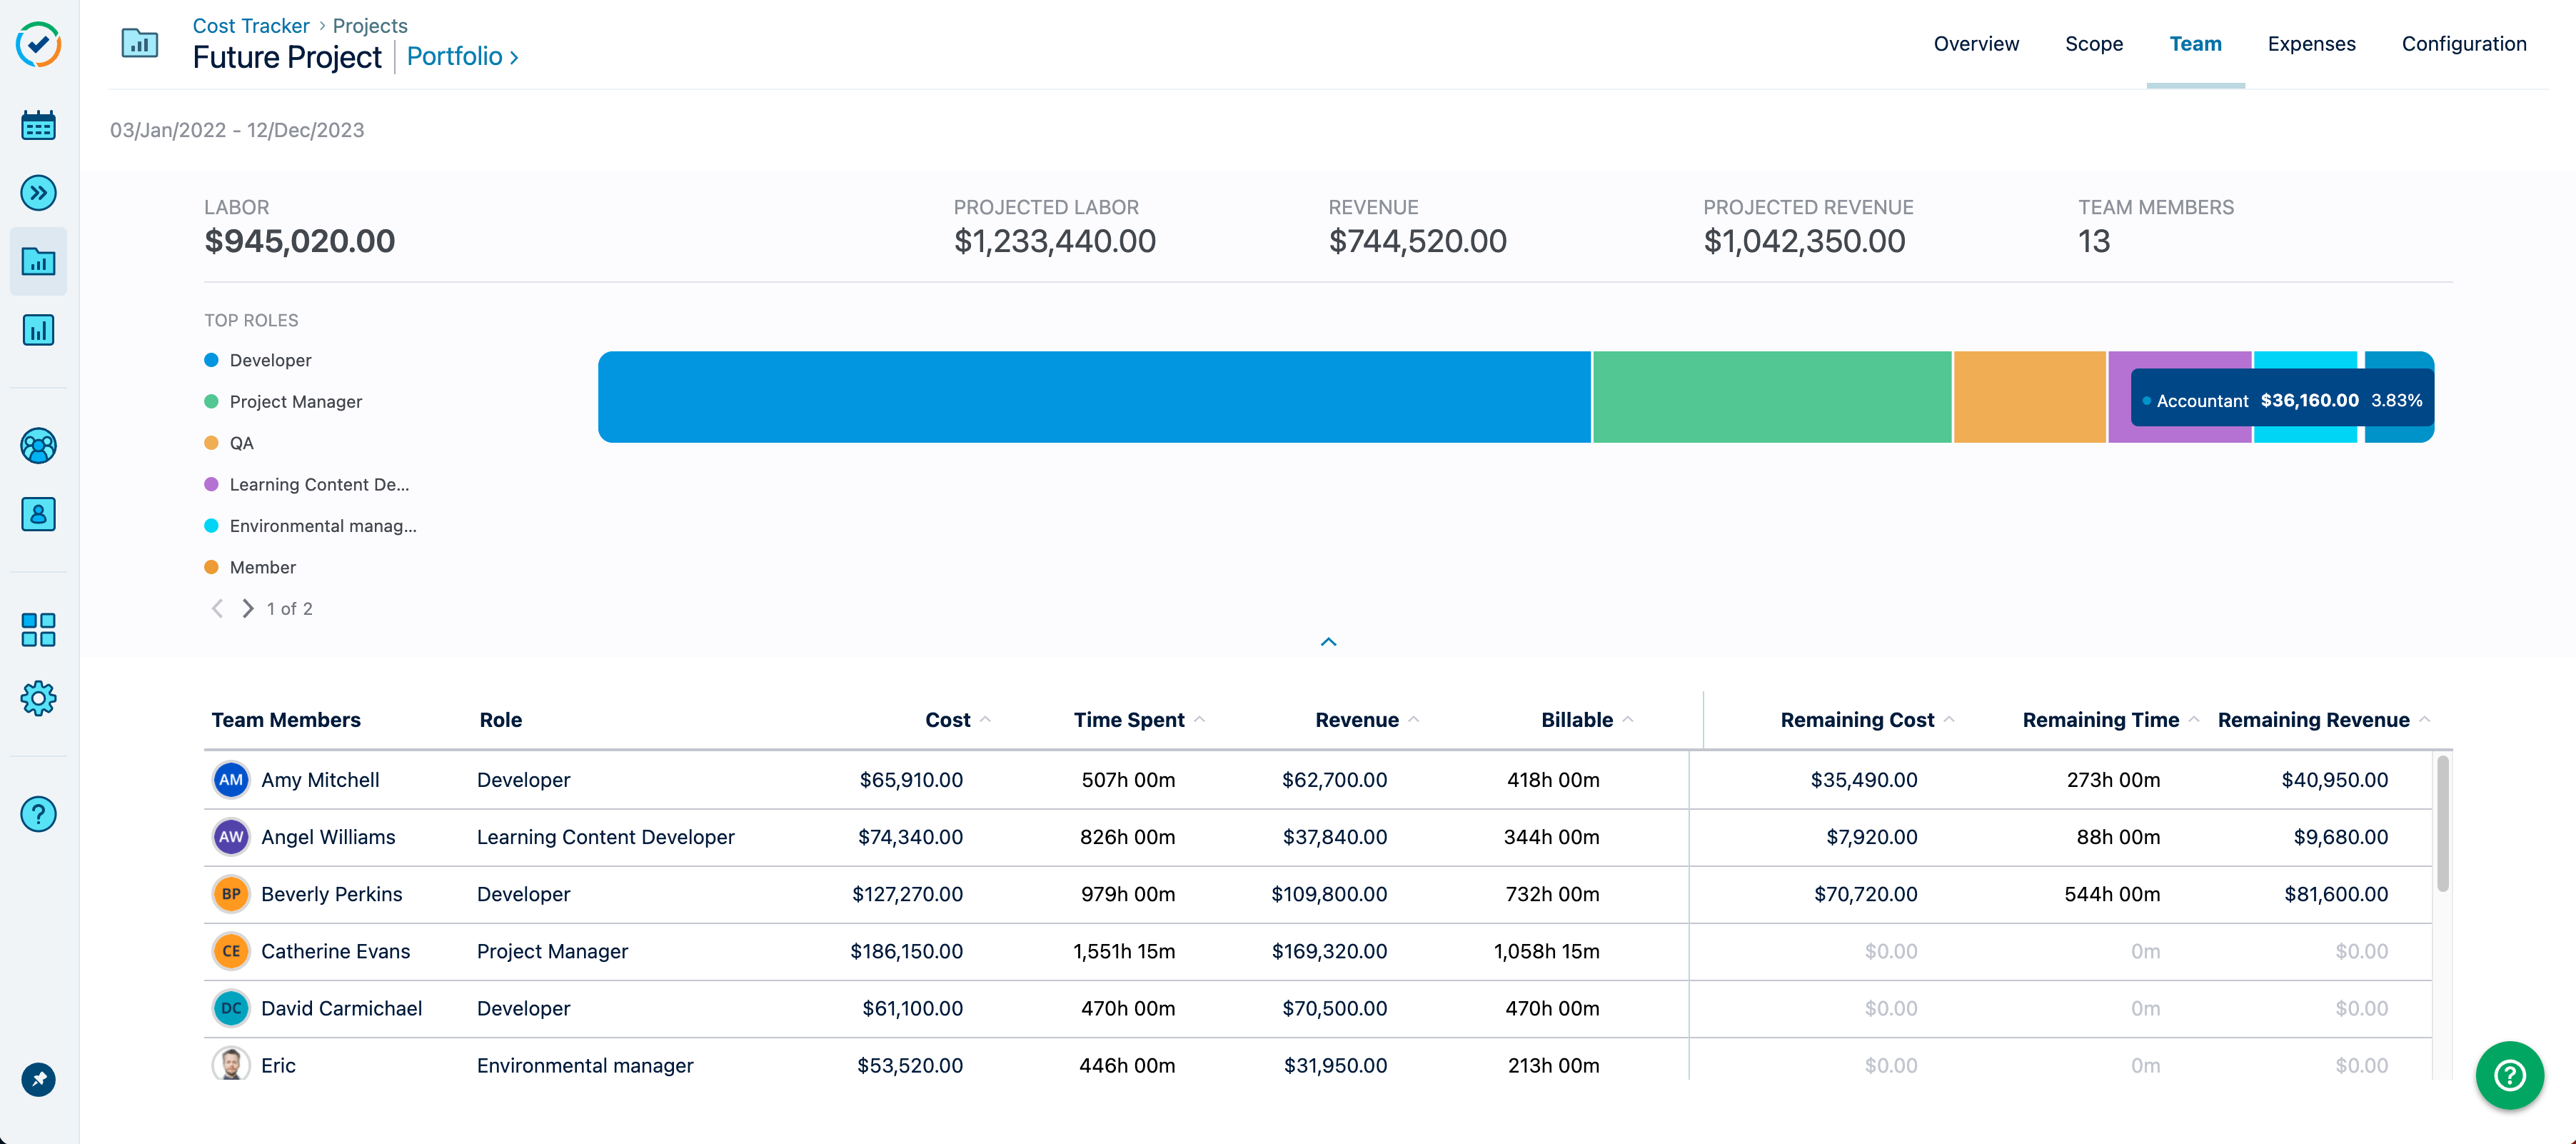
Comparing the Project Team KPIs
Team members are added to the project when time is logged, or when plans are assigned, within the scope of the project.
The Team chart represents the project team's labor cost for the actual time spent, and the projected labor cost for the remaining time. The remaining time, cost, and revenue are calculated based on the planned time that remains after today's date within the timeframe for the project.
To compare the project team KPIs:
Select a project.
Click the Team tab.
Hover over the chart to see the percentage of labor time, cost, and revenue for actual and planned tasks.